Quick Links
- Statewide Summary
- All Account Listing
- Veto Listing
- Local Aid - Section 3
- Outside Sections
- Downloads
- Navigation Guide
- Budget Glossary
- Helpful Links
| SPENDING CATEGORY |
FY2007 Expended |
FY2008 Expended |
FY2009 Expended |
FY2010 Projected |
FY2011 GAA |
|---|---|---|---|---|---|
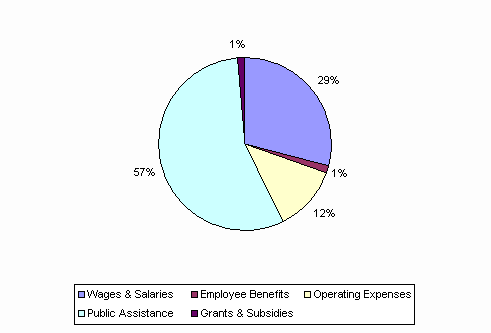
| Wages & Salaries | 364,776 | 380,126 | 376,999 | 345,322 | 329,843 |
| Employee Benefits | 14,892 | 14,765 | 14,653 | 14,584 | 14,736 |
| Operating Expenses | 131,979 | 145,961 | 145,355 | 143,661 | 139,910 |
| Public Assistance | 657,617 | 674,728 | 657,309 | 629,122 | 632,839 |
| Grants & Subsidies | 16,238 | 18,367 | 19,265 | 13,554 | 14,758 |
| TOTAL | 1,185,502 | 1,233,948 | 1,213,582 | 1,146,244 | 1,132,086 |
FY2011 Spending Category Chart
