Quick Links
- Statewide Summary
- Judiciary
- Independents
- Administration and Finance
- Administration & Finance
- Dev. Disabilities Council
- Capital Asset Management
- State Office Buildings
- Office on Disability
- Teachers' Retirement Board
- Group Insurance
- Public Employee Retirement
- Administrative Law Appeals
- George Fingold Library
- Dept. of Revenue
- Appellate Tax Board
- Human Resources Division
- Civil Service Commission
- Operational Services Division
- Information Technology
- Energy & Environmental Affairs
- Health and Human Services
- Transportation
- Housing & Economic Development
- Labor & Workforce Development
- Education
- Public Safety
- Legislature
- All Account Listing
- Veto Listing
- Local Aid - Section 3
- Outside Sections
- Downloads
- Navigation Guide
- Budget Glossary
- Helpful Links
| SPENDING CATEGORY |
FY2007 Expended |
FY2008 Expended |
FY2009 Expended |
FY2010 Projected |
FY2011 GAA |
|---|---|---|---|---|---|
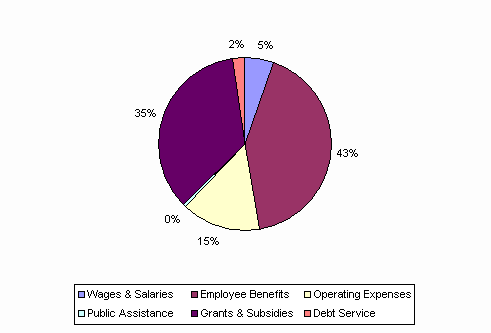
| Wages & Salaries | 180,411 | 180,080 | 178,264 | 167,912 | 169,801 |
| Employee Benefits | 1,046,913 | 879,776 | 1,000,340 | 1,096,184 | 1,293,409 |
| Operating Expenses | 156,826 | 483,805 | 437,464 | 89,176 | 462,857 |
| Public Assistance | 63,374 | 65,708 | 61,928 | 13,351 | 13,099 |
| Grants & Subsidies | 149,058 | 106,654 | 82,644 | 1,036,750 | 1,093,177 |
| Debt Service | 71,660 | 64,256 | 65,108 | 67,991 | 71,690 |
| TOTAL | 1,668,242 | 1,780,279 | 1,825,748 | 2,471,364 | 3,104,034 |
FY2011 Spending Category Chart
