Quick Links
- Financial Statements
- Statewide Summary
- Budget Reductions
- All Account Listing
- Budget Reductions
- Local Aid - Section 3
- Outside Sections
- Downloads
- Navigation Guide
- Budget Glossary
- Helpful Links
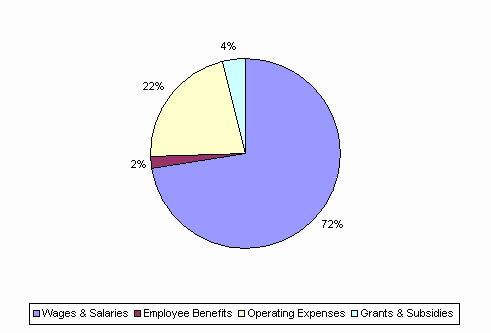
| SPENDING CATEGORY |
FY2006 Expended |
FY2007 Expended |
FY2008 Expended |
FY2009 Expended |
FY2010 GAA |
|---|---|---|---|---|---|
| Wages & Salaries | 13,917 | 13,757 | 14,322 | 14,332 | 14,909 |
| Employee Benefits | 371 | 379 | 343 | 340 | 414 |
| Operating Expenses | 4,273 | 4,390 | 4,280 | 4,383 | 4,433 |
| Grants & Subsidies | 632 | 591 | 516 | 629 | 800 |
| TOTAL | 19,193 | 19,117 | 19,461 | 19,684 | 20,556 |
FY2010 Spending Category Chart