Quick Links
Volume 1
- Budget Message
- Issues in Brief
- Budget Recommendations
- Local Aid to Cities and Towns
- Capital Budget and Debt
Volume 2
- Budget Development
- Financial Statements
- Appropriation Recommendations
- Operating Transfers
- Local Aid - Section 3
- Outside Sections
- Tax Expenditure Budget
- Resources
Department of Higher Education
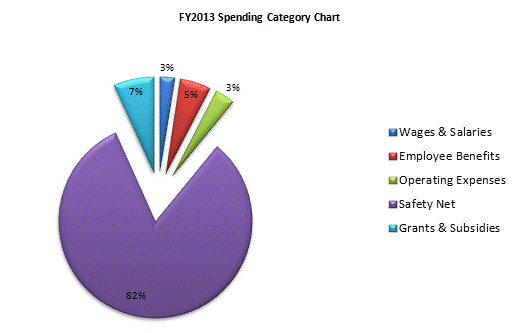
| SPENDING CATEGORY |
FY2009 Expended |
FY2010 Expended |
FY2011 Expended |
FY2012 Projected Spending * |
FY2013 House 2 |
|---|---|---|---|---|---|
| Wages & Salaries | 4,884 | 4,173 | 3,776 | 2,411 | 2,588 |
| Employee Benefits | 5,742 | 5,588 | 5,716 | 5,655 | 5,657 |
| Operating Expenses | 5,892 | 3,001 | 3,585 | 2,905 | 3,645 |
| Safety Net | 95,054 | 88,970 | 86,860 | 88,805 | 89,366 |
| Grants & Subsidies | 3,190 | 742 | 1,630 | 6,435 | 7,301 |
| TOTAL | 114,761 | 102,473 | 101,568 | 106,210 | 108,557 |

 top of page