Quick Links
Volume 1
- Budget Message
- Issues in Brief
- Budget Recommendations
- Local Aid to Cities and Towns
- Capital Budget and Debt
Volume 2
- Budget Development
- Financial Statements
- Appropriation Recommendations
- Operating Transfers
- Local Aid - Section 3
- Outside Sections
- Tax Expenditure Budget
- Resources
Executive Office of Housing and Economic Development
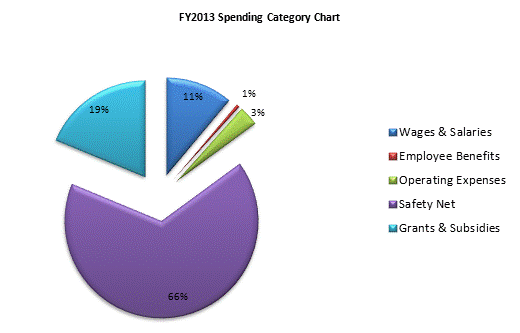
| SPENDING CATEGORY |
FY2009 Expended |
FY2010 Expended |
FY2011 Expended |
FY2012 Projected Spending * |
FY2013 House 2 |
|---|---|---|---|---|---|
| Wages & Salaries | 46,375 | 46,538 | 42,445 | 45,467 | 47,907 |
| Employee Benefits | 1,768 | 1,687 | 1,992 | 2,131 | 2,346 |
| Operating Expenses | 10,563 | 12,191 | 10,935 | 12,230 | 14,315 |
| Safety Net | 50,690 | 223,838 | 233,880 | 253,223 | 285,793 |
| Grants & Subsidies | 102,725 | 76,999 | 77,079 | 81,253 | 80,959 |
| TOTAL | 212,122 | 361,254 | 366,331 | 394,304 | 431,320 |

 top of page