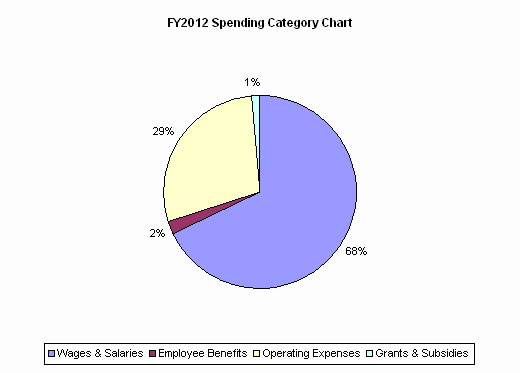
| SPENDING CATEGORY |
FY2008 Expended |
FY2009 Expended |
FY2010 Expended |
FY2011 Projected Spending * |
FY2012 House 1 |
|---|---|---|---|---|---|
| Wages & Salaries | 27,281 | 27,427 | 25,796 | 24,471 | 23,267 |
| Employee Benefits | 586 | 642 | 593 | 705 | 690 |
| Operating Expenses | 14,958 | 17,237 | 13,019 | 13,310 | 9,824 |
| Grants & Subsidies | 1,072 | 1,590 | 8,315 | 1,654 | 488 |
| TOTAL | 43,897 | 46,896 | 47,724 | 40,140 | 34,269 |
