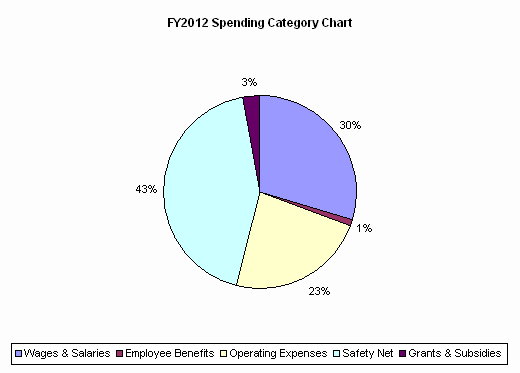
| SPENDING CATEGORY |
FY2008 Expended |
FY2009 Expended |
FY2010 Expended |
FY2011 Projected Spending * |
FY2012 House 1 |
|---|---|---|---|---|---|
| Wages & Salaries | 157,436 | 155,681 | 139,815 | 144,242 | 140,927 |
| Employee Benefits | 4,651 | 4,416 | 4,223 | 5,003 | 4,912 |
| Operating Expenses | 110,131 | 108,955 | 110,031 | 110,527 | 109,047 |
| Safety Net | 258,470 | 264,831 | 220,149 | 222,048 | 204,263 |
| Grants & Subsidies | 18,067 | 19,115 | 13,455 | 14,984 | 13,241 |
| TOTAL | 548,756 | 552,998 | 487,673 | 496,804 | 472,390 |