Budget Summary FY2019

This is not the official budget document.

    SEARCH
    • Statewide Summary
      • Judiciary
      • Independents
      • Administration and Finance
      • Tech Services and Security
      • Energy & Environmental Affairs
      • Health and Human Services
      • Transportation
      • Housing & Economic Development
      • Labor & Workforce Development
      • Education
      • Public Safety
      • Legislature
        • Senate
        • House of Representatives
        • Joint Legislative Operations
    • All Account Listing
    • Veto Listing
    • Local Aid - Section 3
    • Outside Sections
    • Downloads
    • Budget Glossary
    • Helpful Links

    printer friendly

    Home > Legislature > House of Representatives - Historical Spending

    House of Representatives
    Data Current as of:  8/10/2018


    • Budget
      Summary
    • Budget
      Tracking
    • Historical
      Budget
    • Historical
      Spending
    • Agency
      Information
    • Org
      Chart


    HISTORICAL SPENDING CATEGORIES ($000)
    SPENDING CATEGORY
    FY2015
    Expended

    FY2016
    Expended

    FY2017
    Expended

    FY2018
    Projected

    FY2019
    GAA
    Wages & Salaries 31,397 33,778 35,753 12,892 12,892
    Employee Benefits 956 983 982 2,680 2,680
    Operating Expenses 434 561 693 1,037 1,037
    Safety Net 0 0 0 23,668 23,668
    TOTAL 32,786 35,323 37,428 40,278 40,278


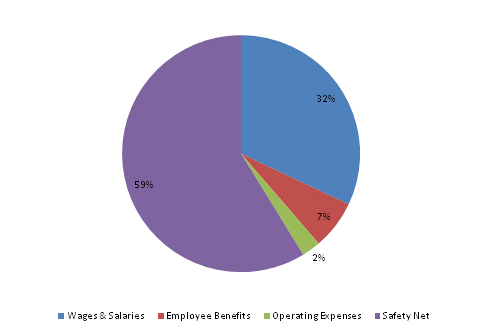
    FY2019 Spending Category Chart

    Pie Chart: Wages & Salaries=32%, Employee Benefits=7%, Operating Expenses=3%, Safety Net=58%


    top of page link top of page

      Related Links

    • Office of the Governor
    • Executive Office for Administration and Finance

      About

    • Site Policies
    • Contact Us
    Massachusetts State Seal

    © 2018 Commonwealth of Massachusetts.

    Mass.Gov® is a registered service mark of the Commonwealth of Massachusetts.