- Statewide Summary
- Judiciary
- Independents
- Administration and Finance
- Tech Services and Security
- Energy & Environmental Affairs
- Health and Human Services
- Health & Human Services
- Elder Affairs
- Public Health
- Mental Health
- Refugees and Immigrants
- Youth Services
- Transitional Assistance
- Children and Families
- Mass Commission for the Blind
- Mass Rehabilitation Commission
- Mass Commission for the Deaf
- Soldiers' Home, Chelsea
- Soldiers' Home, Holyoke
- Developmental Services
- Veterans' Services
- Transportation
- Housing & Economic Development
- Labor & Workforce Development
- Education
- Public Safety
- Legislature
- All Account Listing
- Veto Listing
- Local Aid - Section 3
- Outside Sections
- Downloads
- Budget Glossary
- Helpful Links
Budget Detail
9110-1636 - Protective Services
Data Current as of: 8/10/2018
|
FY2019 House 1 |
FY2019 House Final |
FY2019 Senate Final |
FY2019 GAA |
|
|---|---|---|---|---|
| Budget Tracking | 31,611,680 | 31,611,680 | 31,611,680 | 31,611,680 |
|
FY2016 GAA |
FY2017 GAA |
FY2018 GAA |
FY2018 Projected |
FY2019 GAA |
|
|---|---|---|---|---|---|
| Historical Budget Levels | 23,173,139 | 28,048,120 | 28,661,688 | 28,761,688 | 31,611,680 |
* GAA is General Appropriation Act.
| SPENDING CATEGORY |
FY2015 Expended |
FY2016 Expended |
FY2017 Expended |
FY2018 Projected |
FY2019 GAA |
|---|---|---|---|---|---|
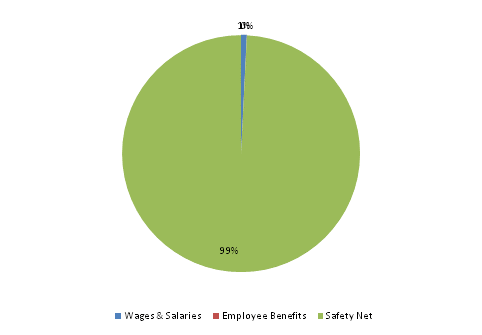
| Wages & Salaries | 238 | 165 | 186 | 237 | 243 |
| Employee Benefits | 6 | 5 | 4 | 5 | 5 |
| Operating Expenses | 112 | 0 | 0 | 0 | 0 |
| Safety Net | 22,406 | 23,063 | 28,128 | 28,520 | 31,364 |
| TOTAL | 22,762 | 23,232 | 28,318 | 28,762 | 31,612 |
FY2019 Spending Category Chart
 top of page