- Statewide Summary
- Judiciary
- Independents
- Administration and Finance
- Tech Services and Security
- Energy & Environmental Affairs
- Health and Human Services
- Health & Human Services
- Elder Affairs
- Public Health
- Mental Health
- Refugees and Immigrants
- Youth Services
- Transitional Assistance
- Children and Families
- Mass Commission for the Blind
- Mass Rehabilitation Commission
- Mass Commission for the Deaf
- Soldiers' Home, Chelsea
- Soldiers' Home, Holyoke
- Developmental Services
- Veterans' Services
- Transportation
- Housing & Economic Development
- Labor & Workforce Development
- Education
- Public Safety
- Legislature
- All Account Listing
- Veto Listing
- Local Aid - Section 3
- Outside Sections
- Downloads
- Budget Glossary
- Helpful Links
Budget Detail
4110-0001 - Administration and Program Operations
Data Current as of: 8/10/2018
|
FY2019 House 1 |
FY2019 House Final |
FY2019 Senate Final |
FY2019 GAA |
|
|---|---|---|---|---|
| Budget Tracking | 1,345,263 | 1,345,263 | 1,345,263 | 1,345,263 |
|
FY2016 GAA |
FY2017 GAA |
FY2018 GAA |
FY2018 Projected |
FY2019 GAA |
|
|---|---|---|---|---|---|
| Historical Budget Levels | 1,486,228 | 1,368,934 | 1,327,646 | 1,327,646 | 1,345,263 |
* GAA is General Appropriation Act.
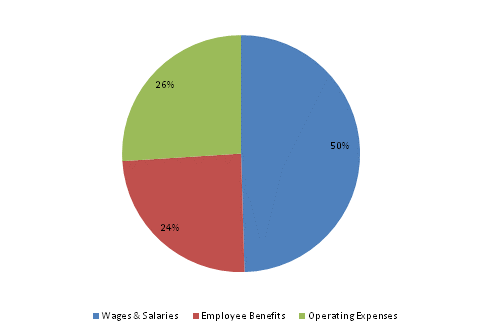
| SPENDING CATEGORY |
FY2015 Expended |
FY2016 Expended |
FY2017 Expended |
FY2018 Projected |
FY2019 GAA |
|---|---|---|---|---|---|
| Wages & Salaries | 648 | 663 | 658 | 653 | 666 |
| Employee Benefits | 338 | 331 | 331 | 329 | 329 |
| Operating Expenses | 346 | 373 | 348 | 346 | 350 |
| TOTAL | 1,332 | 1,367 | 1,337 | 1,328 | 1,345 |
FY2019 Spending Category Chart
 top of page