Quick Links
- Statewide Summary
- All Account Listing
- Veto Listing
- Local Aid - Section 3
- Outside Sections
- Downloads
- Navigation Guide
- Budget Glossary
- Helpful Links
| SPENDING CATEGORY |
FY2011 Expended |
FY2012 Expended |
FY2013 Expended |
FY2014 Projected |
FY2015 GAA |
|---|---|---|---|---|---|
| Wages & Salaries | 49,191 | 46,966 | 52,820 | 55,972 | 64,993 |
| Employee Benefits | 456 | 473 | 416 | 493 | 498 |
| Operating Expenses | 5,458 | 5,532 | 5,599 | 6,089 | 6,484 |
| Safety Net | 148,561 | 229,015 | 255,546 | 266,802 | 272,063 |
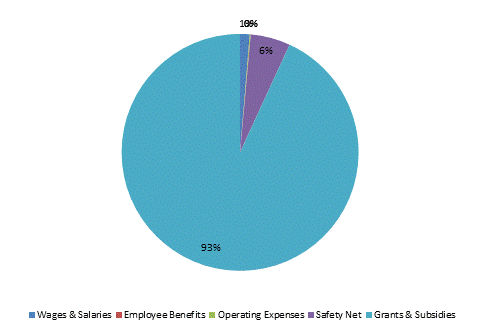
| Grants & Subsidies | 4,060,259 | 4,201,135 | 4,414,599 | 4,573,319 | 4,668,054 |
| TOTAL | 4,263,925 | 4,483,121 | 4,728,980 | 4,902,674 | 5,012,092 |
FY2015 Spending Category Chart
