|
FY2011 House 2 |
FY2011 House 2 Revised |
FY2011 House Final |
FY2011 Senate Final |
FY2011 GAA |
|
|---|---|---|---|---|---|
| Budget Tracking | 10,000,000 | 10,000,000 | 21,001,617 | 15,000,000 | 11,501,617 |
|
FY2008 GAA |
FY2009 GAA |
FY2010 GAA |
FY2010 Projected |
FY2011 GAA |
|
|---|---|---|---|---|---|
| Historical Budget Levels | 21,000,000 | 21,000,000 | 10,000,000 | 30,618,335 | 11,501,617 |
* GAA is General Appropriation Act.
| SPENDING CATEGORY |
FY2007 Expended |
FY2008 Expended |
FY2009 Expended |
FY2010 Projected |
FY2011 GAA |
|---|---|---|---|---|---|
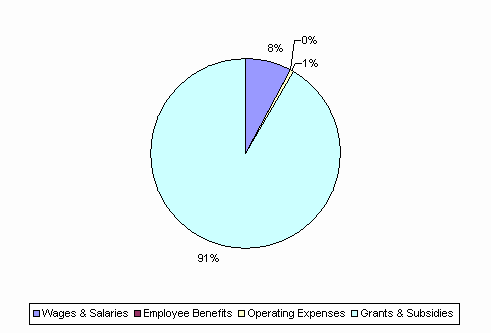
| Wages & Salaries | 1,879 | 1,682 | 1,678 | 1,682 | 882 |
| Employee Benefits | 44 | 55 | 55 | 55 | 21 |
| Operating Expenses | 343 | 339 | 328 | 354 | 59 |
| Grants & Subsidies | 19,976 | 18,041 | 17,705 | 28,528 | 10,540 |
| TOTAL | 22,241 | 20,116 | 19,765 | 30,618 | 11,502 |
FY2011 Spending Category Chart
