FY2009 Budget
Revenue Development
Tax Revenues
Tax revenues comprise nearly 70% of all revenues (including new revenues proposed in the H.2 recommendations) used to support the Commonwealth's operating budget. Each year the Administration and the House and Senate consult with economists and other groups to gather information and analysis on the condition of the U.S. and Massachusetts economies. They use that information to project state tax revenue for use in the state budget. The following is a general description of the consensus revenue process.
General Information Regarding Consensus Revenue
The consensus revenue process is required under M.G.L. c.29, s.5B and states that on or before January 15 the Secretary for Administration and Finance shall meet with the House and Senate Committees on Ways and Means and shall jointly develop a consensus tax revenue forecast for the budget for the next fiscal year, which shall be agreed to by the Secretary and the House and Senate. The law requires that the consensus revenue estimate be placed before the General Court in the form of a joint House and Senate Resolution for full consideration.
On December 13, 2007 the Secretary for Administration and Finance and the House and Senate Committees on Ways and Means held a public hearing in Boston and heard testimony from the Massachusetts Department of Revenue (DOR), the Federal Reserve Bank of Boston, the Massachusetts Taxpayers Foundation and the Beacon Hill Institute. The three branches subsequently agreed upon a fiscal year 2009 tax revenue estimate of $20.987 billion, consistent with testimony presented at the hearing.
As part of the statutorily required consensus revenue process, the Secretary, House and Senate also agree on the amount of tax revenues that will need to be transferred to support the State's Pension Fund, the School Building Authority and the MBTA (Massachusetts Bay Transportation Authority). For fiscal year 2009, these transfers are estimated to total $2.935 billion and will be directed to the following funds:
- School Modernization and Reconstruction Trust Fund = $ 702 million
- MBTA State and Local Contribution Fund = $ 768 million
- Pension Reserves Investment Trust Fund = $ 1.465 billion
$ 2.935 billion total
$ 18.052 billion remaining
Basis for the Fiscal Year 2009 Consensus Revenue Forecast
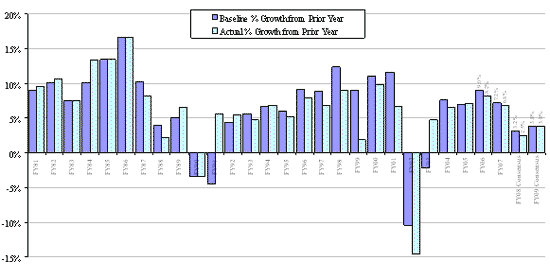
Fiscal year 2008 tax revenues are estimated to be $20.225 billion, representing growth of 2.5% actual and 3.2% baseline over fiscal year 2007 collections (the baseline calculation adjusts for the impact of tax law and processing changes, so is a better indicator of underlying economic activity). Through December 2007, fiscal year 2008 year-to-date tax revenues were up 4.2% actual and 4.8% baseline, and were $22 million above the year-to-date benchmark based on the $20.225 billion estimate.
The fiscal year 2009 consensus tax revenue estimate is $20.987 billion, representing revenue growth of 3.8% actual and baseline from the fiscal year 2008 estimate of $20.225 billion. The fiscal year 2009 estimate assumes that the national and state economies will both experience slowdowns over the next 18 months, but that both will avoid a recession. Specifically, the consensus forecast assumes the following:
- The national economy is expected to experience a slowdown during fiscal year 2009, with real Gross Domestic Product (GDP) growth of 2.2%, versus 2.3% GDP growth in fiscal year 2008.
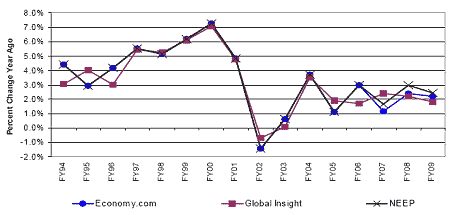
- Massachusetts gross state product is also expected to slow, from a growth rate of 2.2% to 2.4% in fiscal year 2008 to between 1.8% and 2.2% in fiscal year 2009.
- Massachusetts employment is expected to grow 0.6% in fiscal year 2009, compared to 1.0% in fiscal year 2008, and Massachusetts wages and salaries are expected to increase 4.5% in fiscal year 2009, compared to 5.7% in fiscal year 2008.
- Massachusetts personal income is expected to rise 4.6% in fiscal year 2009, compared to 5.7% in fiscal year 2008.
- Massachusetts retail sales are expected to grow by 2.6% in fiscal year 2009, compared to 3.2% in fiscal year 2008.
- After growing by 9.2% in fiscal year 2007, corporate profits at the national level are expected to decline moderately in fiscal year 2008, but then recover in fiscal year 2009. Corporate profits are projected to grow between 1.3% and 3.7% in fiscal year 2009, compared to fiscal year 2008 (there are no forecasts for state corporate profits). This compares with the double-digit growth in the four-year period of fiscal year 2003 to fiscal year 2006.
- Massachusetts capital gains taxes, which grew by about 6.6% in fiscal year 2007, are expected to decline slightly in fiscal year 2008 and then remain flat in fiscal year 2009.
Based on these economic projections, fiscal year 2009 tax collections are projected to grow by $762 million over fiscal year 2008, with income tax collections growing by 5.8% actual and 6.0% baseline, sales tax growing by 3.3% actual and 2.7% baseline, corporate and business taxes declining by 3.3% actual and 3.2% baseline. There is usually a lag between a decline in corporate profits and when that decline is reflected in tax collections, which explains why corporate tax collections are projected to decline in fiscal year 2009, even though corporate profits are expected to grow from the prior fiscal year.
Actual & Baseline Annual Tax Revenue Growth, FY1981-FY2009
(FY08 and FY09 Estimates are Average of 3 Forecasts)
The US Economy
DOR utilizes national and Massachusetts forecasts from Global Insight, Moody's Economy.com, and the New England Economic Partnership. These report the following:
- The national economy is expected to slow substantially over the next several quarters due to the slump in the housing market, the turmoil in the subprime mortgage market, and higher oil prices, though most forecasters believe that a recession will be avoided. Weighing on the economy will be softer personal consumption, a decline in business inventory levels and a continued contraction in residential investment.
- Consistent with slower economic growth, employment growth has slowed in 2007, and it is widely expected that weakening growth in profits will further curtail hiring. US payroll employment rose 1.0% on a year-over-year basis during December 2007, the slowest pace since April 2004. The national unemployment rate in December 2007 was 5.0%. It is expected to increase in the next year.
- The housing market has weakened significantly this year. Sales of new and existing homes have declined. The inventory of unsold new homes has climbed to high levels, home prices have fallen in many areas, and foreclosures have hit record highs. Conditions in the housing market may worsen in the near future and pose a big challenge to the economy.
- In response to the turmoil in the mortgage and financial markets, the Federal Reserve cut the target federal funds rate in September, October, and December. The Federal Funds rate now stands at 4.25%, 100 basis points below the rate three months ago.
- The stock market performed well in the first three quarters of 2007, with the average daily close of the S&P 500 up 12.7% from the same period of last year. However, as corporate profits are expected to slow due to the housing market decline and credit market turmoil, the growth rates in the stock price indices are expected to fall substantially.

Interest Rates Will Moderate Through FY09
(Bank Prime Rate)
The Massachusetts Economy
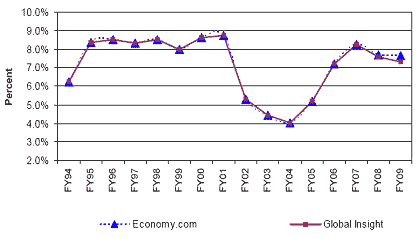
The Commonwealth's employment picture has improved in calendar year 2007. According to the U.S. Department of Labor, state employment in November 2007 grew by 0.9% on a year-over-year basis. Over the same period of time, the unemployment rate decreased from 5.1% to 4.3%.
Massachusetts Employment Forecasts
(Forecast begins in FY08)
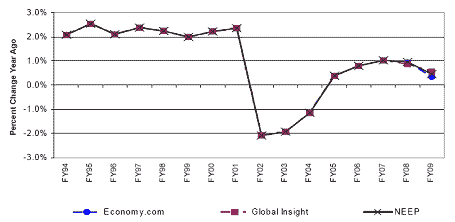
According to the U.S. Census Bureau's most recent reports, Massachusetts wage and salary disbursements in the second quarter of 2007 increased by 6.9% (compared to the same quarter in 2006) after growing by 6.2% in the first quarter. Personal income increased by 6.2% in the second quarter after growing by 6.4% in the first quarter.
Maasachusetts Wages and Salaries Forecasts
(Forecast begins in FY08)
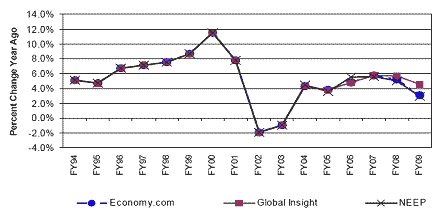
Massachusetts Personal Income Forecasts
(Forecast begins in FY08)

The state's housing market has weakened substantially. According to the Massachusetts Association of Realtors, sales in November 2007 fell by 12.6% for single family homes and 14.2% for condominiums on a year-over-year basis. During the same period of time, the median price fell 2.9% for single family homes and rose 1.9% for condominiums.
Like the national economy, the state economy is expected to grow slowly in 2008 and 2009 as the housing market slump and turmoil in the sub prime mortgage and financial markets impede economic growth through negative effects on construction, household wealth, and consumer spending. Consistent with a slower economy, growth in wage and salary disbursements and personal income are also expected to decline.
Massachusetts Real Gross State Product (GSP) FY1994-09
(Forecast begins in CY 2007)
Capital Gains Taxes
Income tax return data for tax year 2006 received through December 2007 (including data received subsequent to the consensus revenue estimate hearing) indicate that 2006 capital gains realizations were $28.7 billion, versus $26.4 billion in tax year 2005, an increase of 8.5%. Capital gains taxes grew from $1.513 billion in tax year 2005 to approximately $1.627 billion in tax year 2006 (2006 numbers are still preliminary), a 7.5%, and growth in capital gains taxes from tax year 2005 to 2006 is expected to reach about 10% once all tax returns have been received (the 10% growth assumption is reflected in the capital gains graph below). On a fiscal year basis, fiscal year 2007 capital gains taxes are estimated to have totaled about $1.668 billion (though no exact numbers are available on a fiscal year basis), an increase of $104 million, or 6.6%, from fiscal year 2006.
Capital Gains Taxes
Capital Gains Realizations and Taxes - Tax Year Basis
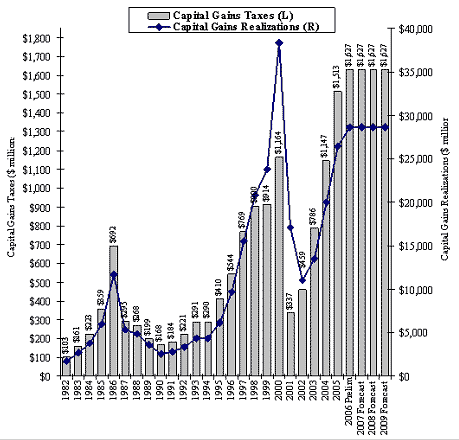
Economy.com (the only economic forecaster that estimates state capital gains realizations) estimates that Massachusetts capital gains realizations will decline by 4% in tax year 2007 and 13% in tax year 2008, then increase by 24.9% in tax year 2009 compared to 2008.
Based on the strength of estimated payments over the past year (which reflects, in part capital gains taxes for tax year 2007), the consensus forecast conservatively assumes that capital gains realizations will be unchanged in tax year 2007 compared to tax year 2006. DOR believes that it is too soon to predict a decline in capital gains realizations for tax year 2008 and an increase in realizations for tax year 2009. The consensus estimated assumes that capital gains realizations will be unchanged from tax year 2007 to tax year 2008 and from tax year 2008 to tax year 2009.
Non-Tax Revenue Assumptions
In addition to annual state tax revenue, the Commonwealth also collects other forms of revenue that are available for expenditure in the budget. These revenues, grouped as federal reimbursements, departmental revenues and consolidated transfers, account for approximately one third of the Commonwealth's budgeted revenues. House 2 is assuming $6.895 billion in federal revenues, $2.577 billion in departmental revenue and a negative $73 million in consolidated transfers for Fiscal Year 2009.
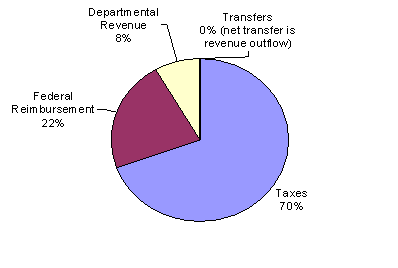
Federal revenues are collected through reimbursement for the federal share of entitlement programs such as Medicaid and through block grants for programs such as Transitional Assistance for Needy Families (TANF). The amount of federal reimbursements to be received is determined by state expenditures for the programs. The Commonwealth receives reimbursement for approximately 50% of its spending for Medicaid programs. Generally, block grant funding is received quarterly and is contingent upon maintenance of effort spending levels determined by the federal government. Staff from the Executive Office for Administration and Finance work with agencies to project budget year spending levels for these federally supported programs.
Departmental Revenues are derived from licenses, tuition, fees and reimbursement and assessments for services including, but not limited to revenues from the Registry of Motor Vehicles, reimbursement of healthcare costs from municipalities participating in the state's Group Insurance Commission (GIC) health care programs, drug rebate money received by the Executive Office of Health and Human Services, interest earnings received on the state's budgeted fund balances, and fees collected by the Secretary of State's Office. MGL Chapter 7:3B provides for an annual review of fees to confirm that they are sufficient to defray the cost of providing the service. As part of this exercise, A&F staff analyzes historical non-tax revenue receipts and works with agencies to develop budget year projections for these revenues. Agencies are asked to review and consider during the budget process whether fees and charges:
- cover the full cost of providing a service;
- have been updated recently; and
- are comparable to what other states charge for similar services.
House 2 includes two sections that give a detailed view of projected non-tax revenue for fiscal year 2009. Section 1B details projected fiscal year 2009 non-tax revenue receipts by the department, board, commission or institution that administers and collects the respective revenue source. The online version of House 2 allows the user to further drill down into each governmental area and view a title and description of each revenue source contributing to that area's total non-tax revenue.
Consolidated Transfers include a number of operating transfers to and from non-budgeted funds of the Commonwealth. These include transfers to support spending in the Health Care Reform funds including the Commonwealth Care Trust Fund and the Medical Assistance Trust Fund. These inflows and outflows also include annual tobacco settlement proceeds received as part of the Master Settlement Agreement with the tobacco companies, net revenues from the State Lottery Fund, fringe revenue to recoup the cost of various statewide benefit assessed on non-budgeted funds, and revenues from the State's Abandoned Property Division. Staff from the Executive Office for Administration and Finance work with agencies and use historical data to project transfers to and from the budgeted funds for the proposed budget year.
New to this year's budget and added for further transparency, Section 1C details the budgetary impact of these sources and uses of funds.
Fiscal Year 2009 Expenditure Development
This fiscal year, agencies prepared "Spending Plans" during summer 2007 and filed them with the Executive Office for Administration and Finance for review in September. The spending plans delineate how funds for the current fiscal year will be spent and build upon that base spending to recommend funding for the next fiscal year. Data that is submitted and analyzed includes the following:
- Personnel changes (backfilling or adding new positions)
- Caseload changes
- Increases or decreases in fixed costs (i.e. utilities and leases)
- Increased costs and/or full-year costs of new contracts with vendors
- Lawsuits and/or court settlements
- Impacts of new legislation enacted - federal or state
- Changes in regulations - federal or state
- Collective bargaining costs and incremental salary adjustments
In addition, agencies recommended new investment initiatives or savings proposals in their respective spending plans.
A&F develops fiscal year funding recommendations based on analysis of agency spending plan submissions. A critical component for development of the fiscal year 2009 budget recommendation is defining a "maintenance" level of funding for a respective agency or program. A maintenance budget is defined as the level of funding necessary to provide the same level of services in a fiscal year as those provided for in the prior fiscal year and to cover expenses which the Commonwealth will be obligated to pay. In defining the projected fiscal year 2009 maintenance level, A&F staff worked closely with counterparts in their respective agencies to monitor and analyze current year spending and revenue collections.
In addition to determining the maintenance level of funding, A&F staff works with agencies to analyze new issues that arise and that may have an impact on upcoming budget recommendations. Here are a few examples of reports and their findings that were incorporated, in part, into the Governor's fiscal year 2009 budget recommendations:
- Study Commission on Corporate Taxation - This Commission was created on April 30, 2007 at the joint direction of the Governor, the Speaker of the House and the Senate President to "review and offer recommendations for streamlining the current tax code". The Commission held numerous open meetings, conducted a public hearing at which 46 witnesses testified, formed six committees that heard from many national experts, and ultimately produced a 686-page final report. The recommendations of the Tax Commission have been included in the Governor's budget recommendations and are described in further detail later in this document.
- State Police Crime Lab Vance Report - On June 29th, 2007, Vance (A Garda Company) released a final report and recommendations regarding their Comprehensive Operational Assessment of the Massachusetts State Police Crime Laboratory System. The report revealed that the Crime Lab had a severe backlog in DNA cases. Backlogs began in 2004, the year that all felons were first required to submit DNA. To address the significant backlog, the report recommended an increase in staffing as well as supplies. The Governor's budget recommendations included a targeted investment of $1.5 million to hire additional staff, to reorganize management, and to upgrade technology.
- Healthy Massachusetts Compact - This is an interagency agreement between the Executive Office of Health and Human Services, the Department of Corrections, Executive Office for Administration and Finance, the Group Insurance Commission, and the Connector Authority to improve health outcomes through greater coordination and alignment among state health programs. Section 23 of the Governor's budget expands "Pay for Performance" incentives to Community Health Centers and Nursing Homes and plans to align quality and cost incentives run by other public agencies to these facilities.
- The Visiting Committee on Management in the Courts Report (Monan Report) -This report, completed in 2003 by a panel of experts, lays out a comprehensive plan for better management of the Commonwealth's court system, including imposing cost and time efficiencies, initiating performance review of individuals and departments and restructuring the Judiciary's line item structure to support these reforms. The Governor's recommendations restructure the line items of the Judiciary consistent with the Monan report recommendations.
- Report of the Commission to Study the Provision of Counsel to Indigent Persons (Rogers Report) - This report recommends several reforms in the public defender system, many of which are ongoing and continue to be funded in the H.2 recommendations, including partial funding for recommended private counsel rate increases.
- The OPEB Commission Report - Established in the fiscal year 2008 GAA, the OPEB Commission recently released a report that defined "what is facing the Commonwealth in terms of pre-funding other post employment benefits (OPEB), the schedule for such funding, management of assets, potential benefits changes, guidance of for municipalities and future steps to take." The Governor's budget recommendations continue to fund current retiree healthcare costs from the State Retiree Benefits Trust Fund, transferring $382 million to the Trust to meet projected expenses. While funding current retiree costs from the Trust does not directly reduce the Commonwealth's OPEB liability, consolidating retiree spending will help the Special Commission and other stakeholders better project the Commonwealth's long term obligation.
Fiscal Year 2009 Budget Challenge
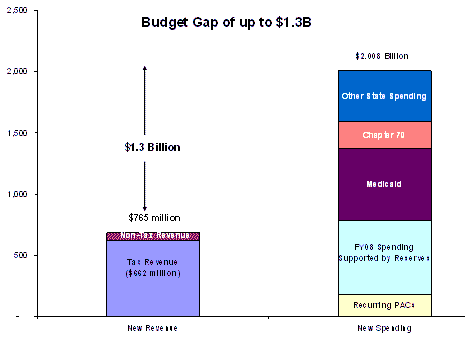
The Commonwealth's fiscal year 2008 budget of $26.808 billion currently relies on about $600 million of reserve transfers and $180 million of non-recurring revenues carried forward from fiscal year 2007. In the aggregate, this means that a structural deficit of $780 million is the starting point for developing a fiscal year 2009 budget that maintains existing services and programs. This does not include spending pressure that exists in fiscal year 2008 from requests for supplemental funding and continued expansion of programs and services.
The fiscal year 2009 budget challenge is compounded by the fact that there are significant pressures on expenditures in fiscal year 2009 for a relatively small number of cost items, including Medicaid, Chapter 70 education aid, and others. Expenditures needed to provide the same level of services in fiscal year 2009 as in fiscal year 2008 are projected to grow by almost 6%, far exceeding the revenue consensus growth of 3.8%.
The structural deficit for fiscal year 2008 together with the projected growth in costs exceeding revenues, not surprisingly, results in a fiscal year 2009 projected shortfall of over $1.3 billion.
Fiscal Year 2009 Budget Solutions
The fiscal year 2009 budget authorizes spending of $28.165 billion, an increase of 5.1% over the fiscal year 2008 General Appropriations Act. Factoring in additional spending now authorized in fiscal year 2008 through supplemental appropriations and prior appropriations continued, the Governor's budget recommendation reflects growth of 3.5% over the current projected spending level for fiscal year 2008.
| FY08 | FY09 H.2 | Variance (H.2 - FY08) | H.2 Growth over FY08 | |
|---|---|---|---|---|
| Projected Spending | ||||
| GAA | 26,806 | 28,165 | 1,359 | 5.1% |
| Prior Appropriation Continued | 339 | |||
| Year-to-Date Supplementals | 75.8 | |||
| Reversions/Deficiencies | -18.9 | |||
| Total Projected Spending | 27,201 | 28,165 | 963 | 3.5% |
| Projected Revenue | ||||
| Consensus Tax Revenue Forecast | 20,225 | 20,987 | 762 | 3.8% |
| Recommendation of the Study Commission on Corporate Taxation | 297 | 297 | ||
| Enhanced Revenue Collections and Enforcement Efforts | 166 | 166 | ||
| Federal Reimbursements | 6,892 | 6,895 | 3 | 0% |
| Departmental Revenue | 2,426 | 2,578 | 152 | 6% |
| Consolidated Transfers | (220) | (73) | 147 | -67% |
| Subtotal | 29,323 | 30,849 | 1,526 | 5.2% |
| Less MBTA | (756) | (768) | (12) | 2% |
| Less SBA | (635) | (702) | (67) | 11% |
| Less Pensions | (1399) | (1465) | (66) | 5% |
| Total Projected Revenue | 26,533 | 27,914 | 1,381 | 5.2% |
The Governor's fiscal year 2009 budget proposal relies on a balanced set of solutions to close the projected shortfall describe earlier. The Governor's budget recommendations are balanced and transparent. The Administration restrained spending through a variety of initiatives that resulted in gross reductions of $479 million ($344 million net) or almost 2% of state spending. This combined with revenue initiatives, spending controls, reforming the Stabilization Fund deposit, and a rational approach to the use of reserves combined to close a $1.3 billion gap.
In addition to these solutions, the budget holds nearly 190 line-items to zero growth in spending for fiscal year 2009. Base spending for these items total almost $1.5 billion in fiscal year 2009.
Balanced Approach
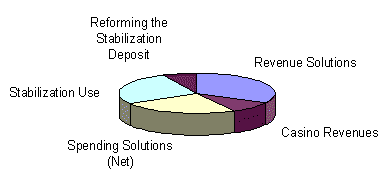
| The Solutions: | (millions) |
|---|---|
| A. Spending Controls and Reductions | |
| Elimination of Earmarks | $(40) |
| State Employee Health Care Contributions | $(51) |
| Constrained growth in agency & program spending | $(84) |
| B. Medicaid Cost Controls and Savings - (Net of Revenue Loss) | |
| Value and Cost Based Purchasing Principles | $(105) |
| Right Care, Right Setting Efficiencies | $(26) |
| Efficient Drug Utilization | $(10) |
| Administrative Savings | $(29) |
| Subtotal of Spending Controls and Reductions ($479M Gross Savings) | $(344) |
| C. Enhanced Revenue Collection and Enforcement Efforts | $(166) |
| D. Recommendations of the Study Commission on Corporate Taxes | $(297) |
| E. Casino Revenues Used to Cover the Lottery Shortfall | $(124) |
| F. Stabilization Use - In Accordance with Administrations Proposed Policy | $(369) |
| G. Reforming the Stabilization Fund Deposit | $(100) |
| Total Solutions: | $(1,399) |
| Note: Total savings cover the budget gap along with limited targeted investments |
A. Spending Controls and Reductions
This budget holds growth in agency and program budgets by, in some cases, reducing maintenance levels of spending that result in aggregate cost savings of $479 million gross savings ($344 million net).
Employee Health Care Contributions ($51 million)
The budget offers comprehensive, affordable health insurance coverage to state employees through the Group Insurance Commission, while including reforms to improve the fairness and sustainability of health coverage for state employees. The budget changes employee contributions from a system based on date of hire to a more rational system based on salary levels and affordability. The following table shows the proposed employee contribution level, which could result in $51 million of budget savings:
| Salary Level | Employee Contribution |
|---|---|
| <$35,000 | 15% |
| $35,000-$50,000 | 20% |
| >$50,000 | 25% |
This reform would reduce contributions for 6,000 state employees - and for another 16,000 state employees, contribution levels would not change. For many other state employees, contribution levels would increase modestly based on salary and affordability. In the aggregate, these reforms would reduce system costs by $51 million in fiscal year 2009, better positioning the Commonwealth over time to continue to provide comprehensive health insurance to state workers.
Elimination of Earmarks (approximately $40 million)
The budget eliminates $40 million of earmarks enacted through last year's budget removing earmarks that, however well-intentioned, were inconsistent with the mission of the agency under which they were funded or otherwise not affordable in a challenging budget year.
Additional Spending Controls ($84 million)
There are over 50 line items where reductions from maintenance levels of spending result in a total of $84 million in savings therefore slowing the growth in these agencies and programs. Additionally, the budget holds nearly 190 line items to zero growth in spending for fiscal year 2009. Base spending for these line items totaled almost $1.5 billion in fiscal year 2008.
B. Medicaid Cost Controls and Savings
This budget includes $303 million in gross savings ($168 million in net savings), and $33 million in net investments necessary to achieve those savings in our state's Medicaid program (MassHealth). These savings helped to control the overall growth in MassHealth from a projected 8.4% increase to a more affordable 5.2% over last year's projected spending levels.
Examples of MassHealth cost containment initiatives include the following:
- Value and Cost-Based Purchasing ($203 million gross/ $105 million net): Reimburses all providers with fair and efficient rates, eliminates special rate earmarks that circumvent the rate-setting process, and focuses on achieving quality performance from all providers. Additional investments of $7 million are needed to accomplish these savings.
- Right Care, Right Setting ($52 million gross/ $26 million net): Provides needed care to individuals in the most appropriate setting, and focuses on chronic disease management as an opportunity to provide better services. Additional investments of $14 million ($7 million net) are needed to accomplish these savings.
- Efficient Drug Utilization ($19 million gross/ $9.5 million net): Focuses on drug utilization management and substitutes medically appropriate generic drugs where possible.
- Administrative Savings ($28.5 million gross): Implements one-time savings related to the implementation of NewMMIS, the system used to make Medicaid payments and draw down FFP.
C. Enhanced Revenue Collections
The Governor's budget includes enhanced revenue and enforcement initiatives that are expected to generate $166 million in additional revenue in fiscal year 2009. These initiatives are described below:
Additional Tax Auditors Initiative ($60 million)
Additional auditors hired at the Department of Revenue (DOR) in fiscal year 2008 will result in $60 million in new revenue for fiscal year 2009. The enacted fiscal year 2008 budget authorized DOR to hire 87 more tax auditors to promote better enforcement of the tax code and improve collection efforts. Although some newly hired auditors have already been working toward these efforts, most of the auditors will not be on board until the 2009 tax season. These additional auditors are projected to generate an additional $60 million for the General Fund.
Tobacco Tax Enforcement Proposals ($33 million)
- Encrypted Tobacco Stamps - Tobacco stamps are used to show payment of taxes. DOR sells stamps to licensed stampers who then affix the stamps on cigarettes before they can be sold in stores. The current stamp technology is easy to counterfeit and therefore ineffective. As a result, the state loses millions of dollars when cigarettes are smuggled into the state and sold with counterfeit stamps. New technology has created encrypted stamping methods that allow the stamp to be tracked from the time it is sold to a stamper through the sale of the product at the retail level. Utilizing this encryption will enable DOR to track cigarette packs throughout distribution to ensure proper tax collection. An investment to purchase the encrypted stamps and to hire and train compliance staff will yield $12 million in fiscal year 2009 and $24 million annually when fully implemented.
- Taxing Cigars and Smoking Tobacco at the Wholesale Level - Cigars and smoking tobacco excise taxes are collected in Massachusetts at the retail level, in contrast to excise taxes on cigarettes and smokeless tobacco, which are collected at the wholesale level. Additionally, while the law requires the licensing of dealers in cigarettes and smokeless tobacco, it does not require the licensing of dealers in cigars or smoking tobacco. The enforcement and collection efforts are difficult because the cigar and smoking tobacco excise is imposed on roughly 4,000 retailers and because the lack of licensing makes tracking of sales and purchases between dealers and identification of non-filers virtually impossible. In fiscal year 2009, DOR proposes to impose these excise taxes at the wholesale level and require the licensing of those wholesalers. As a result, DOR can implement better enforcement and estimates that revenue will increase by $11 million in fiscal year 2009.
- Prepaid Sales Tax on Cigarettes - Collecting sales taxes from the myriad of local cigarette retailers poses a challenge for the Department of Revenue. Retailers may be unlicensed or under-report, making it difficult for the Department to audit, to enforce, and to collect cigarette sales taxes. For fiscal year 2009, DOR will require wholesalers of cigarettes to charge and collect a prepaid sales tax from retailers of cigarettes. Because the number of wholesalers is significantly less than the number of retailers, collections and enforcement activities can be simplified. With this change, DOR estimates that tobacco tax revenue will increase by $10 million in fiscal year 2009.
Wage Enforcement Efforts ($30 million)
Misclassification of employees by employers has resulted in millions of dollars in lost tax revenue each year. Some employers are not following state laws and are inappropriately hiring workers as independent contractors instead of as full time employees. This practice is advantageous for employers since they do not have to pay withholding taxes and are able to avoid paying benefits such as health care and worker's compensation. The Attorney General's Office (AG), along with DOR, the Department of Industrial Accidents (DIA), and the Division of Unemployment Assistance (DUA) will fully implement a statewide initiative to address this ongoing problem. The AG's office along with DOR will make a more visible effort to enforce employee classification laws. The increased public efforts will signal to violators that addressing this problem is a priority for the Commonwealth. As a result, voluntary compliance is expected to increase. Violators will be given the opportunity to comply with the existing laws through a yet-to-be designed program. DOR expects voluntary compliance to be significant since employers would rather come into compliance than face stiff penalties if caught. As a result of this enforcement initiative, DOR expects tax revenue to increase by $30 million. The initiative is modeled after a similar program implemented in New York.
Recording of Liens ($6 million)
The Department of Revenue imposes liens on homeowners who owe taxes to the state. DOR will initiate a special project to file liens against delinquent taxpayers with outstanding debts of over a specified level. To date, DOR has focused on targeting taxpayers that owe more than a specific amount. Filing liens is a manually intensive process as DOR is required to file liens with a property owner's local governing authority. DOR plans to redeploy its employees to create the required staff hours necessary to manually file liens. There are approximately 21,000 people with tax due under DOR's specified amount, for a total of $63 million owed. As a result of the new enforcement initiative, DOR expects to collect $6 million in fiscal year 2009.
Increasing Penalties on Tax Evaders ($25 million)
- Late-Pay Penalties - DOR has the authority to charge penalties against taxpayers who fail to file returns or make payments in a timely manner. Failure to pay an amount reported on a return and failure to pay a deficiency assessment within 30 days of notice generates a penalty of 0.5% per month on unpaid balances. DOR plans to increase these penalties to 1%. As a result of the increase, DOR estimates that revenue will increase by $12 million.
- Demand Fees - DOR is permitted to add a one-time fee to unpaid taxes requiring collection activity. DOR is proposing to increase the demand fee from $5 to an amount not to exceed $30. This new amount is more in line with industry standards. As a result of the increase, DOR estimates that revenue will increase by $4 million.
- Driver's License Revocation - These changes provide that the Registry of Motor Vehicles will suspend a driver's license for nonpayment of taxes upon notification from DOR. Revocation will be integrated into the existing collections process. Evaders will be given at least 30 days notice of any proposed action. The threat of revocations will create a strong incentive for tax evaders to make payments to the Commonwealth. DOR has the authority to revoke the driver's licenses of non-custodial parents that owe child support payments. This tool has been effective in collecting past due child support, and DOR expects it to be equally effective in collecting general tax revenue owed to the state. DOR estimates that the proposal will result in a $7 million increase in tax revenue.
- Withholding on Real Estate Sales Tax - DOR is currently not collecting the maximum amount of taxes from out-of state residents and corporations when they sell their property in the Commonwealth simply because it is more difficult to track out of state buyers/sellers. Because tracking is difficult, DOR needs to better to ensure that out-of-state entities have paid the appropriate amount of taxes upon sale of their property. To address this problem, DOR intends to submit a regulation change that will allow them to withhold an amount of taxes upon purchase for out-of-state buyers. As a result, DOR anticipates additional and appropriate tax collections on these types of transactions will increase revenue by $2 million in fiscal year 2009.
Reducing Tax Exemptions ($12 million)
- Aircraft and Parts Sales Tax Exemption - This change revokes sales and use tax exemptions for aircraft and replacement parts for aircraft enacted in 2001. In some instances, the exemption has resulted in the loss of the entire sales or use tax on an aircraft to another jurisdiction. This change also gives the Commissioner of Revenue authority to impose a tax in situations where an aircraft is placed in an LLC or corporation for state tax avoidance purposes. DOR estimates that the proposal will result in a $9 million increase in tax revenue.
- Pesticides Sales Tax Exemption - This change would eliminate the exemption for household insect sprays and lawn chemicals except when purchased by farmers and licensed applicators, increasing tax revenue by almost $3 million. Pesticides may cause health and environmental problems, and their use should not be encouraged through a broad tax exemption.
D. Recommendations of the Study Commission on Corporate Taxation
The Governor has filed companion legislation to his budget proposal to close corporate tax loopholes that allow avoidance of business tax laws passed by the Legislature. This bill also gradually reduces the business tax rate from 9.5 to 8.3 percent to improve Massachusetts' business competitiveness. These significant tax reforms serve several important public policies including:
- Tax Fairness - All businesses will pay their fair share of the costs of government that benefit them and all of us, and larger and out-of-state businesses will pay at the same rate as smaller and Massachusetts-based businesses.
- Modernization - Massachusetts will join the 21st century and the national tax-policy mainstream. Twenty-two other states, including virtually all Massachusetts' competitors, have already adopted combined reporting, and nearly every other state follows the federal check-the-box rules.
- Competitiveness - The substantial rate reductions will help Massachusetts businesses, especially smaller and in-state ones, compete in the global economy.
- Adequate Revenue - Although some of the new revenue raised by these reforms is being returned to business taxpayers through lower rates, the remainder will help the Commonwealth pay for important investments and public services that benefit businesses and all citizens - like health care, job creation, affordable housing, education, and transportation.
Business Tax Reforms ($297 million)
The two main proposed reforms are:
- Combined reporting - This reform prevents strategies by multi-state businesses to shift income away from corporations doing business in Massachusetts to affiliates in low-tax jurisdictions, thus reducing their taxes paid in Massachusetts. It requires affiliated corporations engaged in unitary business activities to combine their incomes and file as one entity.
- Check-the-Box Conformity - This prevents businesses from filing federal and other-state tax forms as corporations while claiming another status on their Massachusetts tax returns.
In addition, the Governor's bill prevents Internet retail agents from avoiding the hotel/motel tax on the full price of a room as charged to the consumer ($6 million), and clarifies that the earned income tax credit is available only to Massachusetts residents ($2 million).
Corporate Tax Rate Reduction
The Governor also proposes reducing the Massachusetts corporate tax rate from 9.5 percent, nominally the fourth-highest in the nation, to 8.3 percent over the three years after this one. By the standard of total business taxation - currently 40th highest in the nation - Massachusetts will remain among the most economically competitive states. These lower rates, eventually a 13 percent tax reduction, will especially help smaller and Massachusetts-based businesses, which the loopholes closed by this bill have generally not benefited.
E. Casino Revenues Used to Cover Lottery Shortfall
Over the last 20 years, the Massachusetts State Lottery has generated an invaluable source of resources for the state's municipalities to fund essential programs and services to their communities. While experiencing tremendous growth over time, recently the State Lottery's revenue growth has slowed moderately. In fiscal year 2007 and fiscal year 2008, lottery revenues were not sufficient to fully fund programmed distributions to municipalities, and a similar deficit is projected in fiscal year 2009, totaling $124 million. In recognition of the fact that communities are relying on $935 million in Lottery Funds to support local budgets, the Governor's H.2 recommendation uses $124 million in casino licensing revenues, together with projected lottery receipts of $811 million, to fund a total local aid distribution of $935 million in fiscal year 2009.
It should be noted that the State's commitment to cities and towns is to distribute uncapped net lottery revenues to them for unrestricted use to support their municipal budgets. Based on current projections of fiscal year 2009 net lottery receipts, a distribution to cities and towns of $811 million would satisfy this commitment. The Governor, however, recognizes the fact that municipalities have come to rely on an aggregate distribution of $935 million. Although the Commonwealth cannot afford to fund the expected shortfall with existing state resources, passage of the Governor's casino proposal would provide new state revenues that the Governor proposes to dedicate in part to funding this shortfall. The one-time license fees can be used to supplement the Lottery over the next 3 years, during which time Lottery growth is projected to grow to the point where this supplemental funding will no longer be needed.
F. Stabilization Fund
As a part of the balanced approach to solving the fiscal year 2009 budget challenge, the Governor's budget proposal includes a $369 million transfer from the Stabilization Fund. The amount of the transfer is based on a fiscally responsible approach to the use of the Stabilization Fund to support budgeted spending. The following is a general description of the Stabilization Fund and of the Administration's policy for determining the appropriate amount of the budgeted transfer from the fund.
General Information regarding the Stabilization Fund
The Stabilization Fund is established in Chapter 29, section 2H of the General Laws as a reserve of surplus revenues to be used for the purposes of: (1) covering revenue shortfalls, (2) covering state or local losses of federal funds, or (3) for any event which threatens the health, safety or welfare of the people or the fiscal stability of the Commonwealth or any of its political subdivisions. The fund is sometimes referred to as the state's "rainy day fund," serving as a source of financial support for the state budget in times of slow or declining revenue growth and as the primary source of protection against having to make drastic cuts in state services in periods of economic downturns.
The following table shows the amount on deposit in the Stabilization Fund at the end of each of the last 16 fiscal years and the projected balance for fiscal years 2008 and 2009.
Stabilization Fund Balances Since FY92

As indicated in the table above, amounts in the Stabilization Fund provided critical support in maintaining state services in fiscal years 2002 and 2003 when the Commonwealth experienced declining tax revenues in the face of an economic downturn. Since then, surplus revenues have built the fund back up to a healthy balance of $2.335 billion at the end of fiscal year 2007, the third highest reserve fund balance of any state in the nation. The fiscal year 2008 budget proposes to use $240 million from stabilization and $75 million of interest from the stabilization fund for a total of $315 million (this does not include the $100 million deposit not made in fiscal year 2008 as it does not draw from the balance of the fund) bringing the fiscal year 2008 balance to 2.123 billion. For fiscal year 2009 the Governor's budget recommendations rely, to the extent needed, on $370 million of stabilization funding while maintaining the third highest balance in the nation of 1.861 billion.
Budget Stabilization Funds

In recent years, budgeted state spending has exceeded projected revenues and has relied to some extent on the use of Stabilization funds. However, in fiscal years 2004 through 2007, actual state tax revenues exceeded the consensus revenue estimates upon which the budget was developed, ultimately avoiding the need to transfer amounts from the Stabilization Fund to support budgeted spending.
Consensus Revenue vs. Actual Revenues
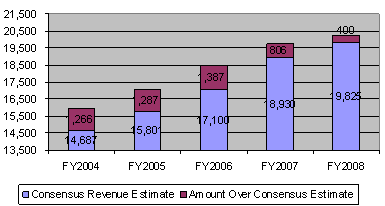
The Governor's budget proposal for fiscal year 2008 relied on $175 million from the Stabilization Fund ($100 million from suspending the deposit and $75 million from interest earnings on the fund), but the final approved fiscal year 2008 budget enacted by the Legislature calls for a $415 million transfer ($100 million from suspending a required deposit to the fund, $75 million from the interest earnings, and a $240 million draw from the balance of the fund). The Commonwealth has already transferred $240 million from the fund to support fiscal year 2008 spending, and it remains to be seen whether state tax revenues will exceed the revised projections for the remainder of fiscal year 2008 to the extent necessary to eliminate the need for further Stabilization Fund transfers or even to reimburse the Stabilization Fund for the amount already transferred. So far, the fiscal year 2008 consensus revenue estimate has been revised upward by the Secretary of Administration and Finance and is currently performing slightly above benchmark as of December.
Policy for Stabilization Fund Use in the Fiscal Year 2009 Budget
The Stabilization Fund should be used judiciously and responsibly to sustain critical state services and programs in the face of changing economic conditions and fluctuating tax revenues. The Commonwealth's prudent funding and use of the Stabilization Fund allowed the Commonwealth to weather the economic downturn in the early years of this decade much more easily than most of the other states in the nation. It is in the long-term financial interest of the Commonwealth to preserve and build a healthy rainy day fund balance in years of strong revenue growth to assist the Commonwealth in weathering future economic storms.
As outlined earlier, the consensus revenue process projects the underlying revenues that support nearly 2/3 of the budget. The accuracy of the consensus tax revenue estimate upon which the budget is based is a key factor influencing whether there will be a surplus contributing to the balance of the Stabilization Fund or a need to draw on the fund. Although this estimate is based on economic models and advice from various experts, it is made 6 to 18 months before the related fiscal year and is consequently unlikely to predict actual tax revenues with precision. As indicated above, consensus tax revenue estimates have been well below actual revenues in recent years. As a result, the Legislature has been enacting budgets that rely on the use of Stabilization Fund transfers which have ultimately not been needed. In addition, large year-end surpluses have been generated and a large portion of these surpluses have been expended outside of the context of the budget-making process through which all state funding priorities are taken into account and weighed against each other. This recent trend in under-estimating tax revenues and ad hoc spending of large year-end surpluses contributes to public skepticism about the budgeting process. It also raises questions about the circumstances under which it is appropriate to rely on amounts in the Stabilization Fund for budgetary purposes.
The primary purpose of the Stabilization Fund is to preserve the fiscal stability of the Commonwealth. In the context of less than certain consensus tax revenue estimates, the Administration believes that the use of the Stabilization Fund as a resource to support the budget can be justified as a means of providing overall budgetary stability. However, the amount of any such budgeted transfer from the Stabilization Fund should be linked to the consensus tax revenue estimate and viewed in the context of historic tax revenue trends to ensure that the planned use of the fund is not excessive.
The following describes the methodology used by the Administration for purposes of determining the appropriate Stabilization Fund amount to support the fiscal year 2009 budget:
- Transfer an amount from the Stabilization Fund that, together with the amount of estimated growth in fiscal year 2009 tax revenues, as determined in the consensus revenue forecast, over the revised fiscal year 2008 tax revenue estimate, will equal the historic annual average growth in actual state tax revenue collections over the last five fiscal years.
- The revised tax revenue estimate for fiscal year 2008 is $20.225 billion, and the consensus revenue estimate for fiscal year 2009 assumes 3.8% growth, or $762 million more than fiscal year 2008 ($20.987 billion).
| Fiscal Year | Total Collections ($ in millions) | Growth (%) | Growth ($ in millions) |
|---|---|---|---|
| 2002 | 14,287 | ||
| 2003 | 14,964 | 4.7% | 677 |
| 2004 | 15,953 | 6.6% | 989 |
| 2005 | 17,088 | 7.1% | 1,135 |
| 2006 | 18,488 | 8.2% | 1,400 |
| 2007 | 19,736 | 6.8% | 1,249 |
| 5 year Average | 6.7% | 1,131 |
The calculation for determining the maximum amount from the Stabilization Fund that may responsibly be used:
| 1. Reach agreement on Consensus Revenue Forecast: | |
| FY2008 | $20,225 |
| FY2009 - 3.8% Growth | $20,987 |
| New Tax Revenues for FY2009: | $762 |
| 2. Determine the actual growth in tax revenue over the past 5 years and develop the average (as shown in chart above) | $1,131 |
| 3. Subtract the new tax revenue growth from the 5 year average of actual tax revenue growth | $369 |
| 4. This is the maximum amount of Stabilization Funds that may responsibly be used: | $369 |
Benefits of the Stabilization Fund Policy in the Fiscal Year 2009 Budget
This approach to budgeting for a Stabilization Fund transfer is fiscally responsible. It provides for budget stability by taking into account the inherent uncertainty of the consensus tax revenue estimate and historic revenue growth trends, and it provides for budget stability in both an increasing and decreasing revenue environment. If tax revenue estimates are too conservative and revenues come in higher than projected as has been the case in recent years, the need to transfer from the Stabilization Fund to support the budget will be reduced or eliminated. If the consensus tax revenue estimates are correct and revenues are less than the five-year historic average, we will need to use Stabilization funds to support base spending and budget stability.
This approach also ensures that the budget is not based on an excessive use of amounts in the Stabilization Fund. By linking the budgeted transfer to the consensus tax revenue estimate and the five-year historic average annual growth in tax collections, this policy ensures that we are not using the Stabilization Fund to support spending beyond what historic trends suggest can be supported by revenues.
In recent years, there has been no rationale behind the amount of Stabilization Fund transfers supporting the budget. This approach provides a fiscally responsible and transparent rationale for the use of the fund.
G. Reforming the Statutorily Required Deposit into the Stabilization Fund
M.G.L. Chapter 29 s5C subparagraph (a )provides that ½ of 1 percent of the total revenues from taxes in the preceding fiscal year be deposited in to the Stabilization Fund. It is important to build up the Commonwealth Stabilization Fund to help cushion the impact of an economic downturn. At the same time, our contributions to growing the fund must be made strategically and weighed against other targeted investments for which those funds could be used to help grow our economy. In this budget, the Governor proposes to amend this provision by allowing investment earnings on the balance of the fund to count toward the statutorily required deposit. This policy ensures that when the fund is at its highest levels, as it has been in recent years, the interest earnings, along with a more modest deposit, should be enough to support continued growth in the fund. Conversely, when the fund balance is at its lowest levels and we cannot rely on investment earnings to help grow our savings a larger deposit would be required. Overall, this policy ensures that limited resources are invested wisely. For fiscal year 2009 the scheduled deposit is estimated to be $107 million and interest earnings are projected to be approximately $100 million. That would mean that a deposit of approximately $7 million will be made for fiscal year 2009.
 top of page