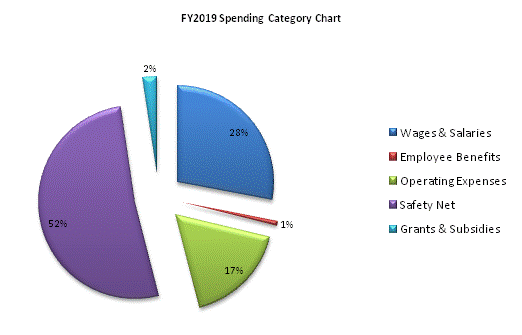
| SPENDING CATEGORY |
FY2015 Expended |
FY2016 Expended |
FY2017 Expended |
FY2018 Projected Spending |
FY2019 House 2 |
|---|---|---|---|---|---|
| Wages & Salaries | 166,994 | 158,064 | 164,617 | 168,706 | 170,244 |
| Employee Benefits | 4,663 | 4,724 | 4,856 | 4,721 | 4,719 |
| Operating Expenses | 88,770 | 89,503 | 86,874 | 100,481 | 104,933 |
| Safety Net | 239,746 | 260,793 | 297,024 | 316,086 | 314,363 |
| Grants & Subsidies | 16,719 | 17,875 | 14,568 | 16,518 | 14,332 |
| Other | 0 | 0 | 0 | 3,141 | 0 |
| TOTAL | 516,892 | 530,959 | 567,939 | 609,652 | 608,591 |
