- Executive Summary
- Preamble & Section 1
- Appropriations Recommendation
- Judiciary
- Independents
- District Attorneys
- Sheriffs
- Governor's Office
- Secretary of State
- Treasurer
- State Auditor
- Attorney General
- State Ethics Commission
- Inspector General
- Campaign Finance
- Comm. Against Discrimination
- Status of Women
- Disabled Persons Protection
- Library Commissioners
- Comptroller
- Office of the Child Advocate
- Cannabis Control Commission
- Mass Gaming Commission
- Center for Health Info and Analysis
- Administration and Finance
- Tech Services and Security
- Energy & Environmental Affairs
- Health and Human Services
- Transportation
- Housing & Economic Development
- Labor & Workforce Development
- Education
- Public Safety
- Legislature
- Line Item Summary
- Local Aid to Cities and Towns
- Outside Sections
- Financial Statements
- Operating Transfers
- Tax Expenditure Budget
- Downloads
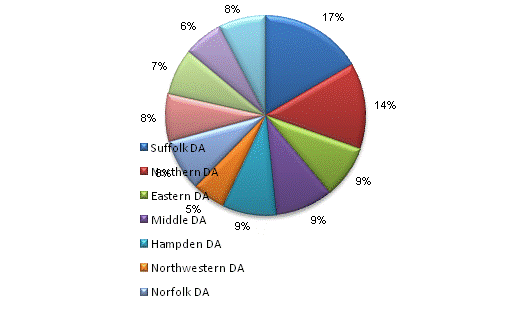
District Attorneys
| DEPARTMENT | FY 2019 Budgetary Recommendation |
FY 2019 Federal, Trust, and ISF |
FY 2019 Total Spending |
FY 2019 Budgetary Non-Tax Revenue |
|---|---|---|---|---|
| Suffolk District Attorney's Office | 20,571 | 517 | 21,089 | 0 |
| Northern District Attorney's Office | 17,183 | 300 | 17,483 | 0 |
| Eastern District Attorney's Office | 10,669 | 700 | 11,369 | 0 |
| Middle District Attorney's Office | 11,562 | 782 | 12,344 | 0 |
| Hampden District Attorney's Office | 10,703 | 304 | 11,007 | 0 |
| Northwestern District Attorney's Office | 6,674 | 0 | 6,674 | 0 |
| Norfolk District Attorney's Office | 10,444 | 475 | 10,919 | 0 |
| Plymouth District Attorney's Office | 9,500 | 750 | 10,250 | 0 |
| Bristol District Attorney's Office | 9,359 | 0 | 9,359 | 0 |
| Cape and Islands District Attorney's Office | 4,911 | 0 | 4,911 | 0 |
| Berkshire District Attorney's Office | 4,492 | 0 | 4,492 | 0 |
| District Attorneys' Association | 7,930 | 0 | 7,930 | 0 |
| TOTAL | 123,998 | 3,829 | 127,827 | 0 |

 top of page