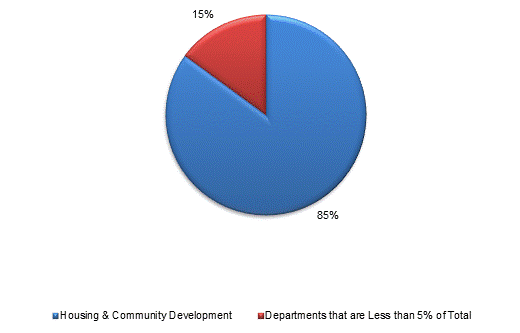
| DEPARTMENT |
FY 2018 Budgetary Recommendation |
FY 2018 Federal, Trust, and ISF |
FY 2018 Total Spending |
FY 2018 Budgetary Non-Tax Revenue |
|---|---|---|---|---|
| Office of the Secretary of Housing and Economic Development | 12,213 | 7,669 | 19,883 | 0 |
| Department of Business Development | 7,676 | 35 | 7,710 | 0 |
| Department of Housing and Community Development | 446,968 | 522,153 | 969,121 | 5,939 |
| Consumer Affairs and Business Regulation | 1,252 | 511 | 1,763 | 1,651 |
| Division of Banks | 20,262 | 193 | 20,456 | 31,185 |
| Division of Insurance | 15,193 | 2,050 | 17,243 | 103,416 |
| Division of Professional Licensure | 16,622 | 12,491 | 29,113 | 43,354 |
| Division of Standards | 1,582 | 0 | 1,582 | 2,627 |
| Department of Telecommunications and Cable | 2,987 | 0 | 2,987 | 5,097 |
| Massachusetts Marketing Partnership | 529 | 10,600 | 11,130 | 0 |
| TOTAL | 525,285 | 555,702 | 1,080,988 | 193,268 |
