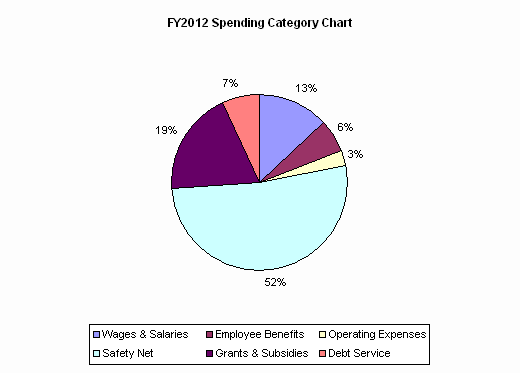
Statewide Summary
| SPENDING CATEGORY |
FY2008 Expended |
FY2009 Expended |
FY2010 Expended |
FY2011 Projected Spending * |
FY2012 House 1 |
|---|---|---|---|---|---|
| Wages & Salaries | 4,306,665 | 4,237,711 | 3,954,786 | 4,113,216 | 4,001,863 |
| Employee Benefits | 1,366,131 | 1,483,615 | 1,584,589 | 1,848,243 | 1,837,411 |
| Operating Expenses | 1,613,930 | 1,130,740 | 1,035,286 | 964,801 | 885,756 |
| Safety Net | 12,590,650 | 13,070,211 | 13,623,101 | 16,308,503 | 15,872,727 |
| Grants & Subsidies | 6,185,698 | 5,785,730 | 5,873,087 | 5,843,436 | 5,809,334 |
| Debt Service | 1,989,968 | 2,007,284 | 1,982,701 | 1,876,335 | 2,141,602 |
| TOTAL | 28,053,041 | 27,715,292 | 28,053,550 | 30,954,534 | 30,548,693 |

 top of page