Capital Budget
Preface
One of the ways in which government can help address the economic hardship we face today is through increased investment in public infrastructure. Investing in infrastructure creates needed construction-related jobs in the short term and builds a foundation for economic growth and job creation over the long term. This means making investments needed to maintain our existing infrastructure – roads, bridges, schools, public housing, etc. – and it means making investments in new types of infrastructure needed to support economic growth in the 21st century – clean energy and energy efficiency, broadband expansion and the life sciences.
In response to the need for bold action to stimulate job creation and to support long-term economic growth, the Patrick-Murray Administration proudly released its five-year capital investment plan for fiscal years 2010-2014 in September 2009. This plan is built on the foundation of the Administration’s work with the Legislature over the past two and one-half years to begin reinvesting in our state’s infrastructure in a fiscally responsible, targeted and transparent manner. Since the Patrick-Murray Administration took office, there have been ten bonds bills enacted into law, authorizing funding for the capital investments reflected in this five-year pan and, in some instances, for years beyond this plan. The capital investments authorized by the bond bills reflect shared priorities of the Governor and the Legislature, including investments in schools, infrastructure to support economic development, roads and bridges, affordable housing, parks, a clean environment and the efficient functioning of state government. These capital investments will create thousands of jobs in the near term and will ensure that Massachusetts continues to be a great place to live, work, start a business and raise a family for years to come.
The capital investment plan continues to implement the vision and priorities established in each of the Administration’s first two capital plans, In large part, the investments included in the fiscal years 2010-2014 plan continue projects launched in prior years or commence projects anticipated by last year’s five-year plan.
Given the economic challenges we face, it is more important than ever that we prioritize our capital investments in a way that will maximize our ability to spur economic growth. Significant investments in Higher Education, the Accelerated Bridge Program and Housing continue to be high on the Patrick-Murray Administration’s list of priorities. And investments in the innovation economy – including expanded Broadband, the Life Sciences and clean energy – will ensure that Massachusetts emerges from this global recession ready to compete in the 21st century.
The Patrick-Murray Administration’s priorities are closely aligned with those of the Obama Administration, which worked with Congress a year ago to enact a $787 billion federal stimulus, some of which will augment the Patrick-Murray Administration’s capital investments, particularly in the areas of transportation, housing and the innovation economy.
The capital investment plan is also fiscally responsible. Two and one-half years ago, the Administration developed and published a debt affordability analysis and policy to ensure that the annual borrowing needed to support the capital investment plan is set at affordable levels. This debt affordability policy was a first for the Commonwealth, and it was positively reviewed by the credit rating agencies. The Administration has updated and republished the debt affordability analysis with the capital investment plan, and the borrowing levels used to develop the plan were determined based on the debt affordability policy. Due to the changing economic and fiscal condition of the Commonwealth over the last two and one-half years, taken into account in the debt affordability analysis and policy, planned borrowing to support capital investments has been reduced by $1.1 billion since the original five-year capital plan published by the Administration tow and one-half years ago.
Through the capital investment plan, the Patrick-Murray Administration is taking advantage of an opportunity to address the current challenges we face in a manner that will position the Commonwealth for economic growth and prosperity over the long-term. This plan provides for the Commonwealth to invest significant resources in infrastructure and other public assets that are critical to our quality of life, the strength of our economy, and the efficient functioning of government at every level. Among other things, these investments will help attract private investments and support long-term economic growth that creates sustainable jobs for our residents; build and maintain roads, bridges and rail we use for our daily commutes; improve public college facilities that educate our workforce and nurture our innovation economy; and create and preserve safe, affordable housing for the people of Massachusetts. Through the investments included in this plan, we will create thousands of jobs in the near term and we will create the environment needed to support job creation and economic growth over the long term.
Introduction
The Commonwealth is responsible for maintaining a large inventory of capital assets, including transportation infrastructure, courts, correctional facilities, state hospitals, office buildings, parks and more. In addition, the Commonwealth makes targeted capital investments to support economic growth, strengthen communities and improve the quality of life in the Commonwealth. These investments include funding for public infrastructure to support private development and job growth, local infrastructure improvements and protection of our natural resources.
These capital investments are planned and funded through the Commonwealth’s capital budget, which is separate and distinct from the annual operating budget. The capital budget is funded primarily by borrowing through the issuance of bonds. The Commonwealth also receives federal funding to support a significant portion of the capital budget, particularly for transportation infrastructure improvements. There are also limited other sources of funding available to finance certain capital investment projects.
The issuance of bonds to fund the capital budget must be authorized by the Legislature. Pursuant to these legislative authorizations to borrow, the Governor determines the amount and timing of any authorized borrowing to fund capital investments. At the request of the Governor, the State Treasurer actually issues the bonds to borrow the funds. The Governor approves the use of the borrowed funds by agencies to pay for authorized capital projects.
The primary factor constraining the amount of the Commonwealth’s capital budget is affordability. The Commonwealth must pay principal and interest costs each year on the bonds it issues to fund its capital investment program. These annual debt service expenses on outstanding Commonwealth bonds are funded each year in the Commonwealth’s annual operating budget. The Patrick-Murray Administration is the first to develop and publish an analysis of the amount of debt the state can afford in terms of its impact on debt service and the operating budget, and it is the first to develop a policy for determining the annual borrowing amount to fund the capital budget.
There are certain capital investments that are not funded by the Commonwealth through its capital budget and consequently are not reflected in this capital investment plan. There are a number of independent state authorities responsible for maintaining certain public infrastructure from revenues generated from those infrastructure assets or from dedicated state tax or other revenues that are not available to the Commonwealth for general budgeting purposes. Examples of these entities include the Massachusetts Bay Transportation Authority, Massachusetts Port Authority and the Massachusetts School Building Authority. Because these entities carry out their own capital projects and are solely responsible for financing them from their own funding sources, the capital investments made by these entities are not included in the state’s capital investment plan. In addition, small equipment purchases and information technology projects funded by state agencies through their operating budgets are not reflected in the capital investment plan.
Administration Accomplishments and Initiatives
Despite the overwhelming need for capital investments and the limited resources available to fund them, the Patrick-Murray Administration has made great progress in improving the Commonwealth’s capital investment program since taking office three years ago. The following highlights summarize some of the Administration’s accomplishments in the areas of capital investments and capital finance generally.
- First-Ever Debt Affordability Policy – The Patrick-Murray Administration developed and published the first-ever debt affordability policy, which has been positively reviewed by credit rating agencies.
- First-Ever Five-Year Capital Investment Plan – The Administration published the first-ever comprehensive and transparent five-year capital investment plan based on the new debt affordability policy. The current plan represents the Administration’s third annual five-year capital investment plan and has been developed within the parameters set forth in the debt affordability policies.
- Bond Bills – After publication of its first five-year capital investment plan in the summer of 2007, the Governor filed a series of multi-year bond bills authorizing over $16 billion in capital investments that, together with the $1.8 billion Immediate Needs Bond Bill passed earlier in 2007, reflected the capital investment priorities for the Commonwealth included in the five-year plan. The legislature overwhelmingly approved each of the bond bills.
- Initiation of Key Projects – A number of important new capital projects and programs have been initiated by the Administration, including: the Accelerated Bridge Program, the South Coast Rail project, the new Worcester State Psychiatric Hospital project, the nano-bio manufacturing facility at the Lowell campus of the University of Massachusetts, new courthouse projects in Taunton, Salem and Fall River, the correctional facilities master plan, the transit projects legally required as mitigation for the Central Artery project and many more.
- Accelerated Bridge Program - The Administration, working with the Legislature and the Treasurer, developed a $3 billion accelerated bridge program which will repair hundreds of structurally-deficient bridges, create new construction jobs, build conditions for long-term economic growth, and save the Commonwealth hundreds of millions of dollars in avoided construction cost inflation and deferred maintenance costs.
- Transportation Reform - On June 26, 2009, the Governor signed legislation to reform the Commonwealth’s transportation system. The legislation consolidates various transportation agencies into a new authority called the Massachusetts Department of Transportation (MassDOT). The consolidation and the reforms in the legislation will, among other things, result in significant savings and increased capacity for investments in transportation infrastructure improvements.
- State Facility Maintenance - The Administration has taken steps to improve maintenance of state facilities. Funding in the capital budget is dedicated for small capital maintenance and repair projects. By dedicating more funding to these types of projects, the state will defer less of its capital investment needs and avoid larger, more expensive capital project needs in the future. The funding for these projects is allocated based on a new, need-based evaluation process through the Division of Capital Asset Management and Maintenance. The Administration is committed to build on its efforts to improve the maintenance of state facilities.
- Energy Efficiency Requirements for State Building Projects - Governor Patrick issued Executive Order 484 which, among other things, established the Governor’s “Leading By Example Program” requiring that all state agencies reduce their environmental impact by promoting energy conservation and clean energy practices. Capital investments in energy efficiency and renewable energy improvements to state facilities are among the efforts underway to comply with Executive Order 484. The Administration has also set high minimum “green building” standards for all new state building projects and is striving to go above and beyond such standards wherever possible, including plans for certain buildings to be “energy neutral”.
- Financing Initiatives - The Administration has pursued various financing initiatives to more effectively leverage state resources to fund more capital project needs. These initiatives include: increased allocation of private activity bond volume cap to multi-family affordable housing projects to leverage related federal tax credits to fund millions of dollars of affordable housing projects, including improvements to our public housing supply; “I-Cubed” legislation to finance infrastructure improvements needed to support new private development with the new state tax revenues generated from the development; and the financing of the East-West Parkway project at the former South Weymouth Naval Air Base from new state tax revenues to be generated from private development at the base.
- Oversight and More Transparency through Finance Advisory Board - Through new gubernatorial appointments, staff support provided by the Executive Office for Administration and Finance, and greater oversight responsibilities included in recent legislation, the Administration has strengthened the role of the Finance Advisory Board in ensuring transparency, accountability and best practices among state entities that borrow, invest and manage public funds. For the first time in the Board’s history, the Board, with Administration assistance, complied with its statutory obligation to gather information about and to report on outstanding debt of the Commonwealth and other debt-issuing state entities. In furtherance of promoting transparency, accountability and best practices, the Board has begun adopting regulations with respect to debt issuance and derivative transactions. In the context of the turmoil in the financial markets over the last twelve to eighteen months, this oversight is critical to ensure public confidence in the sound management of public funds.
American Recovery and Reinvestment Act of 2009 (ARRA)
Closely aligned with Governor Patrick’s priorities and initiatives, the federal American Recovery and Reinvestment Act of 2009 (ARRA) was enacted to preserve and create jobs and promote economic recovery; to assist those most impacted by the recession; to provide investments needed to increase economic efficiency by spurring technological advances in science and health; to invest in transportation, environmental protection and other infrastructure that will provide long-term benefits; and to stabilize state and local government budgets. Funding areas include infrastructure investments; state and local budgetary relief for education, health care, public safety and other programs; support for countercyclical programs such as unemployment insurance, food stamps and workforce training; tax breaks; and other areas such as scientific research and grants.
While most of the ARRA funds have been critical in supporting state and local operating budgets, preserving healthcare, education and other vital safety net services, there are targeted ARRA funds for infrastructure investments which are supplementing the Commonwealth’s capital budget. ARRA funding for infrastructure investments includes funding for housing and community development, transportation and energy efficiency projects. Committed ARRA capital program funds for the Commonwealth include:
- Housing-related ARRA funds to clean up properties in troubled neighborhoods help create new affordable housing, make our homes more energy-efficient, and support community development projects. Massachusetts has received commitments for over $241 million in housing and community development ARRA funding.
- Transportation-related federal stimulus funds for "shovel-ready" state-wide road and bridge projects across the Commonwealth. Massachusetts received authority under ARRA to commit $437.9 million over four years on road and bridge projects, except for $12 million of this amount which will be applied to transit-related projects.
- Energy-related ARRA funds to increase energy efficiency to reduce energy costs and consumption and to reduce reliance on imported energy. Massachusetts will be managing $55 million of ARRA funds under the State Energy Program. Projects to receive funding will include energy efficiency and renewable energy projects, such as solar and wind projects located at state office buildings and higher education facilities.
It should be noted that the ARRA funding amounts reflected in this plan are only the amounts that have been awarded to the Commonwealth for capital investments as of the date of publication of the five-year plan. The Commonwealth expects to receive additional ARRA funding for infrastructure investments pursuant to competitive grant programs to be awarded at future dates, but this plan does not include estimates of any such uncommitted amounts. In addition, ARRA funding for infrastructure investments included in this report are only amounts that are awarded directly to the Commonwealth and do not include amounts awarded directly to the municipalities, independent authorities or other entities in Massachusetts.
In addition to funds that can be applied directly to capital projects, ARRA also provides for the use of new or expanded tax credit bonds as alternative means of financing projects that are typically financed with traditional tax-exempt bonds issued by state and local governments. In December 2009, the Commonwealth issued $956 million of Build America Bonds saving an estimated $130 million over the life of the bonds when compared to tax-exempt bonds. The Commonwealth plans to continue to use such bonds if they provide a clear economic advantage over traditional tax-exempt bond financings.
Development of the Fiscal Year 2010-2014 Capital Investment Plan
The fiscal year 2010-2014 Capital Investment Plan represents the third five-year plan since the Patrick-Murray Administration took office. As with the prior plans, the Administration has engaged in a diligent, fiscally responsible, and comprehensive process for developing this five-year capital investment plan. One common challenge shared by each of the previous five-year plans is the fact that demand for capital improvements far exceeds affordable funding capacity. The inevitable consequence is that many worthy projects will not receive funding.
The distinguishing challenge in this year’s capital budget development is the historic decline in budgeted revenues over the last twelve to eighteen months due to the economic downturn. Exacerbating the constraints imposed by lower revenues is the fact that the vast majority of the capital budget is committed to ongoing projects, which reduces our ability to introduce new or discretionary spending. Finally, increased cost estimates for the large transit projects associated with environmental mitigation relating to the Central Artery/Tunnel project and to which the Commonwealth is legally committed are crowding out other worthy projects.
In order to establish the total amount of the bond-funded capital program within an affordable level, the Administration conducted a rigorous review of the Commonwealth’s debt capacity within its debt affordability policy. The Administration set the bond cap for fiscal year 2010 and the projected bond caps for future fiscal years at lower levels than it had previously planned in order to ensure that the amount of debt issued to fund the capital program is kept within affordable levels consistent with the Administration’s debt affordability policy. Between the fiscal year 2008-2012 Plan and the fiscal year 2010-2014 Plan, planned bond-funded capital investments have been reduced over $1.1 billion during that period.
A full 75 percent of the bond-funded fiscal year 2010 capital budget is needed to fund “hard” commitments, including ongoing construction contracts, investments needed to generate federal matching funds, legal commitments and personnel needed to carry out capital programs. This high level of commitments left limited budget capacity to start new projects in fiscal year 2010 and resulted in the need to scale back historic spending levels for many capital programs. For example, to reach a balanced budget, virtually all grant programs were cut by 10 percent for fiscal years 2010 and 2011 and equipment acquisition programs were cut by 50 percent for fiscal years 2010 and 2011.
The entire fiscal year 2010 capital investment plan are provided in the discussions of investment categories below.
Affordability and Fiscal Responsibility
Because the capital program is funded primarily through bond proceeds, the total size of the capital program is determined primarily by the amount of debt the Commonwealth can afford to issue. Since fiscal year 1991, A&F has established what is known as the “bond cap” to limit annual bond issuance in support of the capital program to affordable levels. For the third consecutive year, the Patrick-Murray Administration engaged in a rigorous analysis of the state’s outstanding debt within affordable levels. Based on this analysis, the Administration has established the fiscal year 2010 bond cap at $1.5 billion, plus $150 million of unused bond cap from fiscal year 2009 that will carry forward and be available for spending in fiscal year 2010, $1.625 billion for fiscal year 2011, $1.75 billion for fiscal year 2012, $1.875 billion for fiscal year 2013 and $2 billion for fiscal year 2014. These bond cap levels are lower in each fiscal year than was previously planned by the Administration in order to ensure that Commonwealth debt is kept to affordable levels within the constraints of the Administration’s debt affordability policy.
In summary, the Administration takes a fiscally responsible approach to setting the annual bond cap, analyzing the Commonwealth’s capacity for debt issuance from the point of view of affordability. Specifically, A&F sets annual constraints on both the size of the bond cap and its future rate of growth.
For purposes of its analysis of existing payment obligations, A&F takes into account not only debt service on general obligation bonds, but also debt service on certain special obligations, contract assistance obligations and certain capital lease payments. Although the accelerated bridge program is being carried out in addition to the regular capital program in order to achieve savings from avoided cost inflation and deferred maintenance and to achieve the other objectives of the program, the debt service resulting from the bridge program is also taken into account within the 8% limit under the debt affordability analysis.
A&F also takes a conservative approach to projecting future budgeted revenues, basing its growth estimate on the lesser of 3% or the actual compound annual growth rate of the Commonwealth’s revenues over the last ten years – which included both economic booms and downturns. A&F models future debt issuance using fiscally conservative assumptions about interest rates, maturities, dates of issuance and market conditions.
Based on this analytic approach, A&F has projected that the Commonwealth will have the capacity to accommodate steady increases in the bond cap over the next four years – albeit at lower levels than originally planned due to economic conditions – while maintaining the percentage of the Commonwealth’s budgeted revenues needed to pay debt service during that period below 8%.
The Patrick-Murray Administration intends to limit the total amount of virtually all future bond-funded capital projects to the bond cap. There are certain, limited circumstances in which the Administration plans to undertake borrowing outside the bond cap when there is a sound policy justification for doing so, however. For example, there are certain projects for which a dedicated stream of new, project-related revenues can be identified to support project costs.
The debt affordability analysis methodology is based on the Commonwealth’s current available financing resources and mechanisms; changes in financing structures and resources in the future may impact how A&F examines the administrative bond cap and the state’s capacity for additional borrowing. The Administration plans to revisit the debt capacity and affordability analysis every year, revising its estimates for future years by taking into account fluctuations in interest rates, budgeted revenues, and other changes impacting the Commonwealth’s debt capacity. In addition, the Administration will annually assess the appropriateness of the methodology and constraints for establishing the bond cap described above.
Aggregate Fiscal Year 2010-2014 Capital Investment Plan
The full five-year capital investment plan by major investment categories is presented below. It should be noted that many of the projects funded in fiscal year 2010 are multi-year projects with costs that will be incurred in subsequent fiscal years; these projected future cost have been taken into account in making investment category reservations for future years. It is also important to note that projects will evolve and change, and A&F intends to adjust the capital plan during the fiscal year as circumstances dictate. Each new fiscal year A&F will also undertake a formal reassessment of capital investment needs to develop an annual update to the five-year capital plan.
Total Bond Cap by Year and by Major Investment Category
The following table and chart show the allocation of bond cap spending by year and then by major investment category.

| (in thousands) | |||||||
| FY10 | FY11 | FY12 | FY13 | FY14 | 5-Year Total | % of 5-Year Total | |
|---|---|---|---|---|---|---|---|
| Community Investments | 234,607 | 222,775 | 241,312 | 259,349 | 244,533 | 1,202,577 | 14% |
| Corrections | 21,134 | 20,500 | 32,200 | 59,700 | 95,400 | 228,934 | 3% |
| Courts | 111,825 | 69,413 | 30,000 | 52,750 | 108,600 | 372,588 | 4% |
| Economic Development | 86,780 | 82,500 | 93,500 | 107,000 | 117,000 | 486,780 | 5% |
| Energy & Environment | 106,817 | 103,353 | 98,231 | 105,851 | 109,132 | 523,384 | 6% |
| Health & Human Services | 92,352 | 83,700 | 79,900 | 45,200 | 67,000 | 368,152 | 4% |
| Higher Education | 83,764 | 123,983 | 151,725 | 231,700 | 235,500 | 826,672 | 9% |
| Housing | 168,000 | 168,000 | 168,000 | 171,000 | 173,000 | 848,000 | 10% |
| Information Technology | 75,260 | 72,919 | 81,957 | 85,747 | 85,625 | 401,508 | 5% |
| Public Safety | 13,300 | 7,950 | 15,150 | 28,000 | 38,600 | 103,000 | 1% |
| State Office Buildings & Facilities | 72,758 | 91,637 | 105,025 | 70,000 | 61,025 | 400,445 | 4% |
| Transportation | 583,402 | 578,271 | 653,000 | 658,703 | 664,585 | 3,137,961 | 35% |
| Total | 1,650,000 | 1,625,000 | 1,750,000 | 1,875,000 | 2,000,000 | 8,900,000 | 100% |
Total Capital Spending by Year and by Major Investment Category
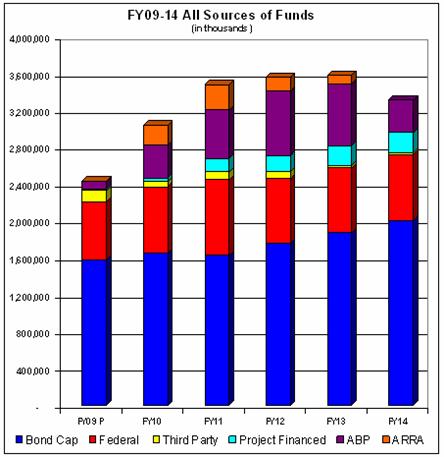
The following chart and table show the allocation of total capital spending from all sources by year and source and then by major investment category. A description of the sources of funding follows.
| (in thousands) | |||||||
| FY10 | FY11 | FY12 | FY13 | FY14 | 5-Year Total | % of 5-Year Total | |
|---|---|---|---|---|---|---|---|
| Community Investments | 294,307 | 279,778 | 283,212 | 295,349 | 280,533 | 1,433,180 | 8% |
| Corrections | 26,234 | 22,200 | 32,200 | 59,700 | 95,400 | 235,734 | 1% |
| Courts | 111,825 | 76,136 | 38,600 | 61,696 | 117,546 | 405,804 | 2% |
| Economic Development | 106,780 | 122,500 | 168,500 | 177,000 | 192,000 | 766,780 | 4% |
| Energy & Environment | 120,591 | 115,717 | 99,085 | 106,145 | 109,426 | 550,964 | 3% |
| Health & Human Services | 93,352 | 88,700 | 83,900 | 45,200 | 67,000 | 378,152 | 2% |
| Higher Education | 98,764 | 169,083 | 199,725 | 233,700 | 235,500 | 936,772 | 5% |
| Housing | 297,318 | 268,439 | 211,623 | 173,466 | 173,000 | 1,123,846 | 7% |
| Information Technology | 78,131 | 75,519 | 81,957 | 85,747 | 85,625 | 494,354 | 3% |
| Public Safety | 39,200 | 19,550 | 19,150 | 28,500 | 38,600 | 145,000 | 1% |
| State Office Buildings & Facilities | 85,258 | 104,137 | 105,025 | 70,000 | 61,025 | 425,445 | 2% |
| Transportation | 1,686,906 | 2,133,290 | 2,230,796 | 2,240,075 | 1,855,178 | 10,146,246 | 60% |
| Totals | 3,038,667 | 3,475,049 | 3,553,774 | 3,576,579 | 3,310,833 | 17,042,277 | 100% |
Description of Sources of Funds
- Bond Cap – Commonwealth borrowing to support the regular capital program
- Federal – federal reimbursements for capital expenditures, primarily for transportation projects
- Third-Party – contributions made by third-parties to capital projects being carried out by the Commonwealth
- Project-Financed – self-supporting bonds payable by the Commonwealth from project-related stream of revenue
- Accelerated Bridge Program – Commonwealth gas tax bonds or federal grant anticipation notes issued to fund the Accelerated Bridge Program
- American Recovery and Reinvestment Act of 2009 (ARRA) – funds provided by the federal stimulus bill directly to the Commonwealth for targeted capital investments.
Comparison of Fiscal Year 2009 Capital Spending and Fiscal Year 2010 Capital Budget
The first table below shows a comparison of fiscal year 2009 projected bond cap spending to fiscal year 2010 budgeted bond cap spending by major investment category. The second table shows a comparison of the total spending from all funding sources of fiscal year 2009 projected results and the fiscal year 2010 budget.
| ($ in thousands) | ||||
| FY09 | FY10 | Difference | % Change | |
|---|---|---|---|---|
| Community Investments | 246,235 | 234,607 | (11,628) | -5% |
| Corrections | 13,311 | 21,134 | 7,823 | 59% |
| Courts | 95,535 | 111,825 | 16,290 | 17% |
| Economic Development | 66,348 | 86,780 | 20,432 | 31% |
| Energy & Environment | 103,592 | 106,817 | 3,225 | 3% |
| Health & Human Services | 54,760 | 92,352 | 37,592 | 69% |
| Higher Education | 68,555 | 83,764 | 15,209 | 22% |
| Housing | 175,500 | 168,000 | (7,500) | -4% |
| Information Technology | 80,587 | 75,260 | (5,326) | -7% |
| Public Safety | 24,526 | 13,300 | (11,226) | -46% |
| State Office Buildings & Facilities | 66,060 | 72,758 | 6,698 | 10% |
| Transportation | 581,991 | 583,402 | 1,411 | 0% |
| Totals | 1,577,000 | 1,650,000 | 73,000 | 5% |
| ($ in thousands) | ||||
| FY09 | FY10 | Difference | % Change | |
|---|---|---|---|---|
| Community Investments | 285,035 | 294,307 | 9,272 | 3% |
| Corrections | 13,711 | 26,234 | 12,523 | 91% |
| Courts | 95,535 | 111,825 | 16,290 | 17% |
| Economic Development | 66,348 | 106,780 | 40,432 | 61% |
| Energy & Environment | 105,912 | 120,591 | 14,679 | 14% |
| Health & Human Services | 54,760 | 93,352 | 38,592 | 70% |
| Higher Education | 77,655 | 98,764 | 21,109 | 27% |
| Housing | 244,438 | 297,318 | 52,880 | 22% |
| Information Technology | 105,426 | 78,131 | (27,295) | -26% |
| Public Safety | 40,687 | 39,200 | (1,487) | -4% |
| State Office Buildings & Facilities | 66,060 | 85,258 | 19,198 | 29% |
| Transportation | 1,276,778 | 1,686,906 | 410,128 | 32% |
| Totals | 2,432,344 | 3,038,667 | 606,322 | 25% |
Fiscal Year 2010 Capital Budget and Investments by Category
The five-year capital investment plan for each investment category is presented below with highlights of fiscal year 2010 spending.
Community Investment – $294.3 million
The Patrick-Murray Administration is committed to partnering with Massachusetts cities and towns to improve infrastructure, promote economic growth, and make Massachusetts a convenient and attractive place to do business. The Administration is also committed to supporting municipal grant programs that make important local investments in public safety, affordable housing, smart growth development strategies, and energy efficiency. Highlights of Community Investments projects and grant programs funded in fiscal year 2010 include the following:
- Maintaining increased funding levels for Chapter 90 municipal road and bridge projects.
- Funding for the Commonwealth’s share of a $125 million new regional agricultural and vocational school, maximizing efficiency of public and private community resources for education and job creation.
- $13.5 million for Library Construction Grants to match municipal and private contributions for the construction of new town libraries.
Corrections – $26.2 million
The age of correctional facilities and the changing needs of the prison population create significant systemic and capital facility challenges. To address these issues, the Patrick-Murray Administration initiated a system-wide master planning process which began in late 2007 and is expected to be released soon. The master planning process has resulted in a complete assessment of the conditions and needs of the correctional system and makes recommendations with respect to programs and strategic capital investment opportunities for correctional facilities statewide. Although certain facilities have compelling needs when evaluated in isolation, it is critical that our limited capital investment resources be invested in a thoughtful and cost-effective manner to meet the programmatic demands and objectives of the entire correction system.
This master planning process and facility repairs (as opposed to new facility expansions) have been the primary focus since fiscal year 2008. Funding in fiscal year 2010 will begin the implementation of the master plan’s recommendations and is targeted to urgent repair needs.
Courts – $111.8 million
The Department of Corrections operates 18 institutions with five security levels ranging from contract pre-release to maximum security. These facilities house over 10,000 criminally sentenced inmates in the jurisdiction of the Department of Corrections, 650 incarcerated as civil offenders and 575 pre-trial or awaiting trial offenders. The total custody overcrowding rate is approximately 140%. In addition to the correctional facilities managed by the Department of Corrections, the Commonwealth has eighteen jails, houses of correction and related correctional facilities located in fourteen Massachusetts counties and managed by county sheriffs.
Capital spending for judiciary projects is administered through the Division of Capital Asset Management (DCAM), which has spent approximately $487 million on courts projects over the past five years, 37% of its total capital spending. Continued investment is necessary not only for the effectiveness of court operations, but also for the health and safety of court staff and members of the public who participate in the judicial system.
In fiscal year 2010, DCAM will continue to manage several new court construction projects, including construction of new facilities in Fall River, Salem and Taunton. In addition, demolition has begun in preparation for construction of a new courthouse in Lowell.
Economic Development – $106.8 million
The Massachusetts economy is the largest in New England and the 13th largest in the nation. Having a robust economy is important not only for the Commonwealth’s own residents, but also for the economic vitality of the region and the country. Similar to the experience of states throughout the country, the Commonwealth has been hit by the recession and unemployment has risen from 6.1 percent in November 2008 to 8.8 percent in November 2009. A critical component of the Governor’s recovery plan for Massachusetts is not only to stimulate job creation today, but to make investments that support long-term economic growth. The Patrick-Murray Administration is focused on doing just that through strategically targeted capital investments that attract private investment and support the innovation economy of the future.
Highlights of fiscal year 2010 capital investments in economic development include the following:
- $22 million for the Massachusetts Opportunity Relocation and Expansion (MORE) Jobs capital program, which provides grants for public infrastructure improvements that support business expansion and relocation.
- $13 million for the “Growth Districts Infrastructure Investment Program” as a means of expediting commercial and residential development within designated areas in the Commonwealth. The initiative offers a focused approach to work with each community where a growth district is located to ensure that all required permits are secured, site preparation is completed, infrastructure improvements are identified, and marketing resources are made available on an expedited basis.
- $30 million in fiscal year 2010 – and an estimated $250 million over the next five years - for Governor Patrick’s ten-year, $500 million Life Sciences Initiative capital program. This capital program supports continued growth in one of Massachusetts key industries. These capital investments include the building of new research centers that will attract academic and industry leaders to Massachusetts from around the globe, including beginning construction of the Sherman Center at the University of Massachusetts Medical School - Worcester.
- $15 million for the Broadband Initiative, which will invest capital funds in long-lived, carrier-neutral infrastructure assets to promote broadband expansion to unserved and underserved areas, starting with Western Massachusetts.
It should be noted that the capital investments reflected above in the Economic Development investment category include only the projects and programs in the fiscal year 2010-2014 capital investment plan that are designed first and foremost for the purpose of supporting economic development. There are, however, hundreds of millions of dollars more in planned investments reflected in the Transportation, Community Investment and other investment categories in the capital investment plan that will support economic development and the creation of jobs in the Commonwealth.
Energy & Environment – $120.6 million
The Executive Office of Energy and Environmental Affairs (EOEEA) stewards an incredible diversity of natural resources and infrastructure for the Commonwealth. Ten percent of the Commonwealth’s land mass is in state parks, forests and other conservation lands – including 450,000 acres of state forest and park systems. In addition to state parks and forests, the Department of Conservation and Recreation (DCR) manages 29 campgrounds, 87 beaches, 340 dams, 524 miles of urban parkways, and 2,000 miles of trails. The Department of Fish and Game oversees over 157,000 acres of Wildlife Management Areas and maintains over 275 boat ramps and public access fishing and boating sites.
Managing these resources requires significant investments from both the operating and capital budgets. In particular, capital funds pay for important infrastructure projects, such as flood control measures, dam rehabilitation, improvements to recreational facilities, wildlife habitat protection, environmental hazard remediation, park and trail maintenance, and open space acquisition. Other agencies within EOEEA invest capital resources in projects and programs that contribute to clean water, clean air, clean energy, natural resources, agricultural resources and more.
Highlights of the fiscal year 2010 energy and environment capital investments include:
- Complete Georges Island Visitor Center which will have extensive exhibits, shade shelter, concession services, event space and a gift shop to anchor Georges Island as a hub of Boston Harbor Islands State Park and to enhance it as a tourism destination. The installation of solar panels and the energy conservation measures at the visitor center will have projected annual savings of two-thirds of the current operating costs.
- The capital investment plan provides for $45 million in fiscal year 2010 dedicated to open space protection. Some of these land protection investments are in the form of grants to municipalities and are reflected in the Community Investment category described above. In the aggregate these land protection investments are being targeted to three main objectives: (1) the creation of urban parks, (2) the preservation of natural landscapes and habitats; and (3) the preservation of working landscapes.
- Maintain robust swimming pool program to complete rehabilitation of five urban pools by fiscal year 2013.
- Commence the $10.3 million Winthrop Shores restoration project which includes beach nourishment for shore protection, parkway reconstruction and reconstruction of storm drainage.
Health & Human Services – $93.4 million
The Executive Office of Health and Human Services (HHS) provides critical services for the Commonwealth and is the largest segment of the executive branch, accounting for nearly half of the Commonwealth’s operating budget each year. HHS facilities are numerous: more than 800 structures, encompassing over 10 million square feet of state-owned space, are spread over 36 state campuses. These structures include hospitals, clinics, long and short-term care facilities, offices, and support facilities such as power plants and garages. Many of these facilities operate 24 hours per day, 7 days per week, year-round.
Investments in fiscal year 2010 are highlighted below and continue to be concentrated in the construction of a new hospital, while advancing the Administration’s efforts toward addressing the backlog of physical plant needs in the state’s health and human service facilities.
- $65 million for the construction of a new 320 bed psychiatric facility on the grounds of Worcester State Hospital – a project that will replace and consolidate two outdated existing Department of Mental Health facilities, resulting in expected annual operating savings of approximately $4.15 million from efficiencies such as reduced overhead and staffing costs and a more energy-efficient facility.
- $15 million for urgent repair and replacement needs at various HHS facilities, including oxygen delivery, fire safety upgrades, ventilation, and heating and cooling systems.
- Continuation of a strategic master plan to assess HHS’s needs for state-owned assets and community based services. The master plan seeks to better match the state assets with the agencies’ missions and to reduce capital repairs and operating costs in order to target HHS dollars to the provision of programs and services.
Higher Education – $98.8 million
The Commonwealth’s higher education system, which serves approximately 260,000 students, is comprised of 29 campuses divided into three segments: 15 community colleges, nine state colleges and five University campuses. In response to the alarming capital deficiencies at many of these institutions, Governor Patrick dramatically increased planned spending for higher education capital projects in the first five-year capital plan in fiscal year 2008, and he obtained passage of a $2.2 billion, 10-year higher education bond bill in 2008 as a key component of his 10-year education reform initiative.
The state’s capital investment in higher education will increase each year, and by 2013, higher education investments will represent 12% of the total bond-cap funded capital budget, compared to just 3% in fiscal year 2007. Total estimated bond-funded spending over the five-year period is $826 million, ramping up over the course of five years as construction projects get underway to an annual investment of over $235 million by fiscal year 2014.
This significant capital investment in higher education is exclusive of additional amounts that will be invested in public higher education facilities as a part of the Life Sciences Initiative capital program included in the Economic Development investment category described above. In addition, while the chart below reflects amounts the University and college campuses are contributing to projects being carried out and primarily funded by the Commonwealth and reflects ARRA funding that the Commonwealth is investing in higher education campuses, it does not reflect additional amounts of campus funding and ARRA funding received directly by the campuses that the campuses invest in capital projects that they carry out.
Fiscal year 2010 capital investments in higher education will support the objectives and areas of strategic focus of our public colleges and universities. Highlights of the fiscal year 2010 capital plan for higher education include:
- Continue or complete construction projects at three state or community colleges and three at different University of Massachusetts campuses.
- Start construction for major projects at Bridgewater State College, Massachusetts Maritime Academy, North Shore Community College and Greenfield Community College.
- Commence studies or design for major new projects at ten sites, including Holyoke Community College, Mass College of Liberal Arts, Fitchburg State College, Salem State College, Quinsigamond Community College and Bristol Community College as well as at University of Massachusetts Boston, Dartmouth, Amherst and Lowell campuses.
Housing – $297.3 million
State spending for housing in Massachusetts includes both state-supported public housing and private affordable housing development. The Commonwealth’s state-supported public housing is a unique and valuable resource, consisting of more than 50,000 units in 242 cities and towns. The state’s public housing portfolio supports some of our most vulnerable residents and includes more than 32,000 units of housing for the elderly, 12,900 units for veterans, and 2,000 units for clients of many of the state’s human services agencies – in all, providing homes for more than 80,000 residents. The portfolio suffered neglect for the 16 years prior to this Administration assuming office, resulting in an inherited backlog of expired building systems and significant components that need replacement. As a way to offset the negative effects of the high costs of private housing in Massachusetts, both for renters and owners, the Commonwealth’s private affordable housing development programs use a variety of financing resources, ranging from grants and loans to tax-credits, to support the production and preservation of affordable private housing.
Highlights of the fiscal year 2010 capital plan for housing and representative projects are presented below:
- $99.4 million (including $5 million through the Affordable Housing Trust Fund and $12.5 million in ARRA funds through the Weatherization Assistance Program) invested in public housing. Continuing Governor Patrick’s commitment to public housing, this is an 89% increase in funding for public housing compared to funding levels prior to the Patrick-Murray Administration. In addition to these investments through the state capital budget, the Administration intends to continue to leverage affordable housing tax credits to increase investment in public housing.
- $81 million in total spending for various private affordable housing development programs, including $35 million from the Affordable Housing Trust Fund (which is net of the $5 million in the Fund statutorily dedicated to public housing), one of the Department of Housing and Community Development’s (DHCD) most flexible funding sources and a key means of supporting affordable home ownership and affordable rental housing.
Information Technology – $78.1 million
The Information Technology Division (ITD) manages a wide array of information systems: 183 data centers, 100 phone systems, 24 e-mail systems and 15 data networks - many of which are aging and no longer meeting all the modern-day business needs of state government. These vast and decentralized systems are too complex to manage efficiently and make it difficult to maintain security. In addition, these systems for the most part cannot work effectively together, preventing agencies from partnering in providing the kinds of information and services the public has come to expect in the Internet age.
The fiscal year 2010-2014 capital plan makes investments in major state-wide information systems as well as advancing the strategic goal of consolidating state-wide information technology to promote efficiency, effectiveness and security.
Highlights of fiscal year 2010 information technology capital spending include:
- $2.5 million for the Automated Licensing and Registration System (ALARS) modernization project for the Registry of Motor Vehicles, which is estimated to take five years to implement.
- $9.5 million in modernizing the Commonwealth’s public safety technology infrastructure.
- $9.2 million to begin deployment of the new Quest unemployment insurance system.
- $5.2 million to continue the implementation the State Police digital wireless public safety radio network. The project will perform radio tower and associated site improvement work at 17 locations and install a microwave infrastructure.
- $2.8 million to continue the development of MassTax2, which will be a secure, user-friendly system that will integrate all tax administration functions.
Public Safety – $39.2 million
The Commonwealth’s capital spending supports important public safety projects and programs that ensure the safety of our residents and communities. Public safety capital investments range from carrying out projects at Massachusetts military facilities to addressing the equipment and facilities needs of the state police, chief medical examiner, homeland security and emergency response agencies.
Fiscal year 2010 public safety-related investment highlights include:
- $16 million for continuation of the expansion of the Massachusetts Firefighting Academy at Stow, the state’s primary training center for fire fighters, and funding to begin construction of a new fire training facility in the City of Springfield. Recently enacted legislation authorizes the Commonwealth to raise the amounts needed to fund related debt service costs for fire training facility projects through assessments on property insurance policies. Thus, these projects are reflected as “project financed” in the table above.
- $1.9 million to complete construction of a new consolidated Municipal Police Training Facility in western Massachusetts.
- $1.4 million for a strategic master plan for the State Police. This comprehensive study is intended to help the Commonwealth better align the facilities infrastructure of the State Police with the needs of its operations. The majority of barracks were constructed in the 1920’s and 1930’s and state policing operations have significantly changed since that era.
- $7 million for the replacement program for new state police cruisers and helicopters.
It should be noted that the investments shown above do not include public-safety related information technology investments or investments in correctional facilities, which instead are included in the Information Technology and Corrections categories described elsewhere in this report.
State Office Buildings & Facilities – $85.3 million
Safe, convenient and accessible state office buildings and facilities are necessary for the efficient and effective functioning of government and for providing programs and services. They are also important venues for active civic engagement. These buildings and facilities have important safety and accessibility needs for both workers and visitors. As a result of years of neglect, many state office buildings require structural improvements, as well as repairs to roofs and building envelopes to prevent leaks that lead to further structural damage. Several state office buildings require elevator replacements and other improvements necessary to comply with building codes and American Disabilities Act (ADA) accessibility requirements. Fire alarms, sprinkler systems, power plants and HVAC systems must also be updated. The fiscal year 2010-2014 capital investment plan builds on the progress made over the last two years to improve state office buildings and facilities.
Highlights of the fiscal year 2010 capital investment plan include:
- The continuation of a competitive process managed by DCAM to distribute $30 million to state agencies for small deferred maintenance projects at various state-owned facilities.
- $7.8 million is allocated for design, pre-construction services and initial construction activity for a Second Data Center in Springfield. This mission critical facility will be an active back-up to the current data center in Chelsea and will run concurrently with that facility. It will have higher levels of security and reliability and will support emergency response as well as enable data center consolidation as outlined in Executive Order 510.
- $3.9 million in spending on elevator modernization in the McCormack State Office Building.
- $9 million for improvements to the roof and fire alarm system of the State House.
Transportation – $1.7 billion
The Commonwealth’s transportation investment needs are extraordinary. The Patrick-Murray Administration has significantly increased investments to improve our roads, bridges, transit and other transportation system assets by allocating a larger portion of the capital budget over the last two years to transportation investments, initiating the Accelerated Bridge Program, and securing additional revenue dedicated to transportation. This trend of increased investment in transportation infrastructure continues in this updated five-year capital investment plan. In addition, the recently enacted transportation reform legislation will result in significant operating cost savings from reforms and consolidation of our transportation agencies into the new Massachusetts Department of Transportation and thereby free up additional funds for needed infrastructure investments.
The following are some of the specific capital investment highlights of the fiscal year 2010 transportation capital investment plan:
- $848.3 million for statewide road and bridge projects, including federal reimbursements and ARRA funds.
- Approximately $65.6 million to address the State Implementation Plan (SIP) transit project commitments, including $46.9 million for the Fairmount Commuter Rail project, $8.7 million for the Green Line extension, $6 million for the Red Line-Blue Line connector study and $4 million for the new parking spaces initiative.
- $15.6 million to continue the planning phase of the South Coast Rail project, which will extend the MBTA’s commuter rail service to Fall River and New Bedford.
- $18.5 million for DCR parkways and bridges.
It should be noted that the funding identified for MassHighway and the Executive Office of Transportation and most of the funding identified for the Department of Conservation and Recreation transportation assets in this capital plan – including amounts invested pursuant to the Accelerated Bridge Program described below – were transferred to the Massachusetts Department of Transportation (MassDOT) together with the related road and bridge assets after the establishment of MassDOT on November 1, 2009. The Highway Division of the new MassDOT will assume responsibility for all of the MassHighway road and bridge assets, the DCR bridge assets and certain parkway assets, the Turnpike Authority assets and the Tobin Bridge, which will all be consolidated for operating purposes to achieve efficiencies in the management and operation of the state’s road and bridge assets.
Accelerated Structurally-Deficient Bridge Program
On August 4, 2008, Governor Patrick signed into law a $3 billion bond bill, known as the Accelerated Bridge Program bond bill. The Accelerated Bridge Program will repair bridges across the Commonwealth that are currently structurally deficient or would otherwise become structurally deficient during the next eight years. Instead of seeing the number of structurally deficient bridges increase by approximately 30% over the next eight years, the number will be reduced by approximately 15% during that time. Major bridge repair projects across the state will be accelerated, including the Longfellow Bridge over the Charles River, the Fore River Bridge in Quincy, the Whittier Bridge in Amesbury and the Route 9 Bridge over Lake Quinsigamond in Shrewsbury and Worcester, as part of the program.
The goals and objectives of the Accelerated Bridge Program are to:
- Improve the safety and condition of bridges in the Commonwealth, with a focus on structurally deficient bridges and on bridges projected to become structurally deficient in the next eight years, so that by the end of the Program, the number of structurally deficient bridges will be approximately 250 fewer than would be the case under existing revenue streams.
- Create thousands of construction-related jobs and maintain the critical infrastructure necessary for the long-term economic growth of the Commonwealth.
- Generate significant cost savings by accelerating projects now, thereby avoiding construction cost inflation and cost increases due to deterioration caused by deferred maintenance.
- Complete projects on time and on budget and with minimum disruption to people and commerce. Innovative means of contracting and construction techniques have been employed.
- Conduct the entire Program with transparency and accountability by providing frequent and detailed reports to the public on the progress of the Program, develop project controls to ensure adherence to project schedules and budgets, and measure agency performance in streamlining design and construction schedules against benchmarks.
The total authorized amount for the eight-year program is $3 billion, of which $2.1 billion is allocated to MassHighway for bridges under its control or owned by cities and towns and approximately $900 million is allocated to the Department of Conservation and Recreation (DCR) for bridges that, prior to the creation of MassDOT, were under its control. The total amount expected to be expended in fiscal year 2010 is $352 million. By the end of fiscal year 2010, 27 bridge repair projects are expected to have been completed under the program and an additional 104 bridge projects will be in construction.
 top of page