- Statewide Summary
- Judiciary
- Independents
- District Attorneys
- Sheriffs
- Governor's Office
- Secretary of State
- Treasurer
- State Auditor
- Attorney General
- State Ethics Commission
- Inspector General
- Campaign Finance
- Comm. Against Discrimination
- Status of Women
- Disabled Persons Protection
- Library Commissioners
- Comptroller
- Office of the Child Advocate
- Cannabis Control Commission
- Mass Gaming Commission
- Center for Health Info and Analysis
- Administration and Finance
- Tech Services and Security
- Energy & Environmental Affairs
- Health and Human Services
- Transportation
- Housing & Economic Development
- Labor & Workforce Development
- Education
- Public Safety
- Legislature
- All Account Listing
- Veto Listing
- Local Aid - Section 3
- Outside Sections
- Downloads
- Budget Glossary
- Helpful Links
Office of the State Comptroller
Data Current as of: 8/10/2018
| SPENDING CATEGORY |
FY2015 Expended |
FY2016 Expended |
FY2017 Expended |
FY2018 Projected |
FY2019 GAA |
|---|---|---|---|---|---|
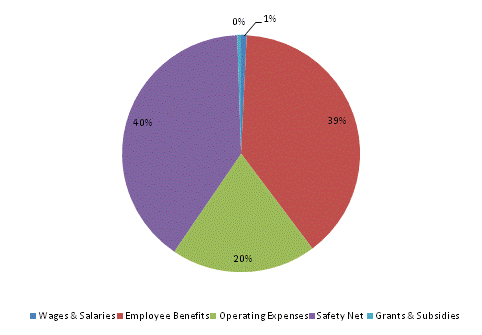
| Wages & Salaries | 10,687 | 11,322 | 11,027 | 8,253 | 8,715 |
| Employee Benefits | 420,529 | 426,453 | 445,184 | 433,557 | 441,316 |
| Operating Expenses | 576,795 | 279,386 | 389,776 | 825,970 | 224,308 |
| Safety Net | 79,128 | 673,718 | 412,221 | 585,051 | 452,450 |
| Grants & Subsidies | 0 | 0 | 0 | 9,000 | 5,874 |
| TOTAL | 1,087,138 | 1,390,878 | 1,258,208 | 1,861,831 | 1,132,663 |
FY2019 Spending Category Chart

 top of page