- Statewide Summary
- Judiciary
- Independents
- Administration and Finance
- Tech Services and Security
- Energy & Environmental Affairs
- Health and Human Services
- Health & Human Services
- Elder Affairs
- Public Health
- Mental Health
- Refugees and Immigrants
- Youth Services
- Transitional Assistance
- Children and Families
- Mass Commission for the Blind
- Mass Rehabilitation Commission
- Mass Commission for the Deaf
- Soldiers' Home, Chelsea
- Soldiers' Home, Holyoke
- Developmental Services
- Veterans' Services
- Transportation
- Housing & Economic Development
- Labor & Workforce Development
- Education
- Public Safety
- Legislature
- All Account Listing
- Veto Listing
- Local Aid - Section 3
- Outside Sections
- Downloads
- Budget Glossary
- Helpful Links
Budget Detail
5930-1000 - State Facilities for People with Intellectual Disabilities
Data Current as of: 8/10/2018
|
FY2019 House 1 |
FY2019 House Final |
FY2019 Senate Final |
FY2019 GAA |
|
|---|---|---|---|---|
| Budget Tracking | 102,822,708 | 102,784,019 | 102,322,708 | 102,784,019 |
|
FY2016 GAA |
FY2017 GAA |
FY2018 GAA |
FY2018 Projected |
FY2019 GAA |
|
|---|---|---|---|---|---|
| Historical Budget Levels | 112,092,314 | 109,353,183 | 103,956,247 | 103,648,800 | 102,784,019 |
* GAA is General Appropriation Act.
| SPENDING CATEGORY |
FY2015 Expended |
FY2016 Expended |
FY2017 Expended |
FY2018 Projected |
FY2019 GAA |
|---|---|---|---|---|---|
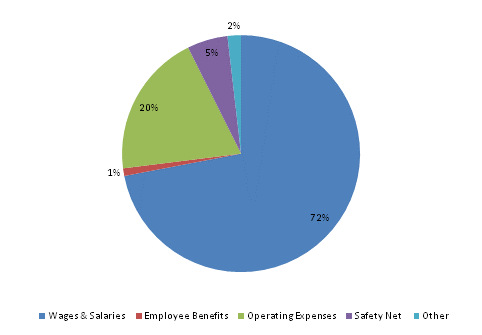
| Wages & Salaries | 80,221 | 77,185 | 78,263 | 73,903 | 73,994 |
| Employee Benefits | 1,594 | 1,589 | 1,445 | 1,083 | 1,067 |
| Operating Expenses | 22,384 | 20,791 | 20,149 | 19,911 | 20,135 |
| Safety Net | 5,595 | 6,035 | 6,080 | 7,151 | 5,696 |
| Other | 1,892 | 1,892 | 1,892 | 1,600 | 1,892 |
| TOTAL | 111,685 | 107,491 | 107,828 | 103,649 | 102,784 |
FY2019 Spending Category Chart

 top of page