- Statewide Summary
- Judiciary
- Independents
- Administration and Finance
- Tech Services and Security
- Energy & Environmental Affairs
- Health and Human Services
- Health & Human Services
- Elder Affairs
- Public Health
- Mental Health
- Refugees and Immigrants
- Youth Services
- Transitional Assistance
- Children and Families
- Mass Commission for the Blind
- Mass Rehabilitation Commission
- Mass Commission for the Deaf
- Soldiers' Home, Chelsea
- Soldiers' Home, Holyoke
- Developmental Services
- Veterans' Services
- Transportation
- Housing & Economic Development
- Labor & Workforce Development
- Education
- Public Safety
- Legislature
- All Account Listing
- Veto Listing
- Local Aid - Section 3
- Outside Sections
- Downloads
- Budget Glossary
- Helpful Links
Budget Detail
4200-0200 - Residential Services for Detained Population
Data Current as of: 8/10/2018
|
FY2019 House 1 |
FY2019 House Final |
FY2019 Senate Final |
FY2019 GAA |
|
|---|---|---|---|---|
| Budget Tracking | 28,942,669 | 28,442,670 | 29,442,669 | 29,442,669 |
|
FY2016 GAA |
FY2017 GAA |
FY2018 GAA |
FY2018 Projected |
FY2019 GAA |
|
|---|---|---|---|---|---|
| Historical Budget Levels | 26,687,833 | 27,633,139 | 28,581,402 | 27,881,402 | 29,442,669 |
* GAA is General Appropriation Act.
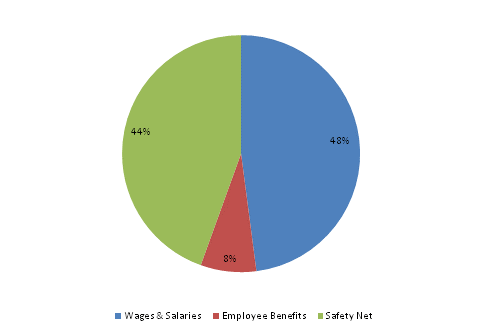
| SPENDING CATEGORY |
FY2015 Expended |
FY2016 Expended |
FY2017 Expended |
FY2018 Projected |
FY2019 GAA |
|---|---|---|---|---|---|
| Wages & Salaries | 10,966 | 11,193 | 11,884 | 12,908 | 14,113 |
| Employee Benefits | 1,448 | 1,296 | 1,449 | 2,172 | 2,234 |
| Operating Expenses | 0 | 0 | 0 | 0 | 0 |
| Safety Net | 12,859 | 13,627 | 14,059 | 12,301 | 13,096 |
| Other | 0 | 0 | 0 | 500 | 0 |
| TOTAL | 25,273 | 26,116 | 27,393 | 27,881 | 29,443 |
FY2019 Spending Category Chart
 top of page