- Statewide Summary
- Judiciary
- Independents
- Administration and Finance
- Tech Services and Security
- Energy & Environmental Affairs
- Health and Human Services
- Health & Human Services
- Elder Affairs
- Public Health
- Mental Health
- Refugees and Immigrants
- Youth Services
- Transitional Assistance
- Children and Families
- Mass Commission for the Blind
- Mass Rehabilitation Commission
- Mass Commission for the Deaf
- Soldiers' Home, Chelsea
- Soldiers' Home, Holyoke
- Developmental Services
- Veterans' Services
- Transportation
- Housing & Economic Development
- Labor & Workforce Development
- Education
- Public Safety
- Legislature
- All Account Listing
- Veto Listing
- Local Aid - Section 3
- Outside Sections
- Downloads
- Budget Glossary
- Helpful Links
Budget Detail
4000-0700 - MassHealth Fee for Service Payments
Data Current as of: 8/10/2018
|
FY2019 House 1 |
FY2019 House Final |
FY2019 Senate Final |
FY2019 GAA |
|
|---|---|---|---|---|
| Budget Tracking | 2,625,178,033 | 2,641,228,033 | 2,630,178,033 | 2,646,228,033 |
|
FY2016 GAA |
FY2017 GAA |
FY2018 GAA |
FY2018 Projected |
FY2019 GAA |
|
|---|---|---|---|---|---|
| Historical Budget Levels | 2,489,792,092 | 2,377,838,433 | 2,187,898,930 | 2,952,455,632 | 2,646,228,033 |
* GAA is General Appropriation Act.
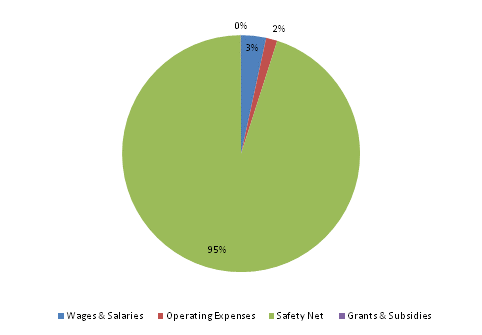
| SPENDING CATEGORY |
FY2015 Expended |
FY2016 Expended |
FY2017 Expended |
FY2018 Projected |
FY2019 GAA |
|---|---|---|---|---|---|
| Wages & Salaries | 17,144 | 20,822 | 31,917 | 90,000 | 90,034 |
| Operating Expenses | 10,426 | 19,077 | 22,648 | 40,458 | 40,474 |
| Safety Net | 2,390,287 | 2,183,115 | 2,470,552 | 2,820,997 | 2,514,470 |
| Grants & Subsidies | 0 | 20,274 | 8,750 | 1,000 | 1,250 |
| TOTAL | 2,417,856 | 2,243,288 | 2,533,867 | 2,952,456 | 2,646,228 |
FY2019 Spending Category Chart
 top of page