Quick Links
- Statewide Summary
- Judiciary
- Independents
- District Attorneys
- Sheriffs
- Governor's Office
- Secretary of State
- Treasurer
- State Auditor
- Attorney General
- State Ethics Commission
- Inspector General
- Campaign Finance
- Comm. Against Discrimination
- Status of Women
- Disabled Persons Protection
- Library Commissioners
- Comptroller
- Office of the Child Advocate
- Mass Gaming Commission
- Center for Health Info and Analysis
- Administration and Finance
- Energy & Environmental Affairs
- Health and Human Services
- Transportation
- Housing & Economic Development
- Labor & Workforce Development
- Education
- Public Safety
- Legislature
- All Account Listing
- Veto Listing
- Local Aid - Section 3
- Outside Sections
- Downloads
- Navigation Guide
- Budget Glossary
- Helpful Links
| SPENDING CATEGORY |
FY2012 Expended |
FY2013 Expended |
FY2014 Expended |
FY2015 Projected |
FY2016 GAA |
|---|---|---|---|---|---|
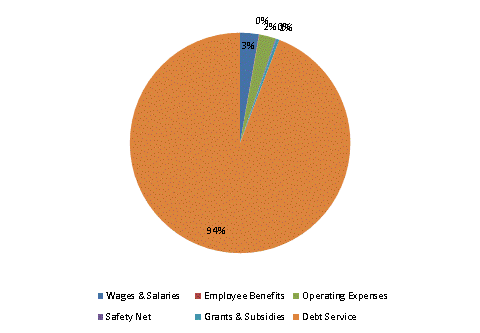
| Wages & Salaries | 38,240 | 43,717 | 45,032 | 49,189 | 67,576 |
| Employee Benefits | 1,695 | 1,295 | 1,300 | 1,438 | 1,510 |
| Operating Expenses | 56,377 | 56,511 | 56,724 | 57,771 | 58,907 |
| Safety Net | 3,519 | 3,557 | 2,263 | 2,863 | 3,142 |
| Grants & Subsidies | 4,156 | 4,088 | 5,462 | 8,822 | 11,080 |
| Debt Service | 1,954,381 | 2,145,814 | 2,162,652 | 2,232,645 | 2,310,657 |
| TOTAL | 2,058,367 | 2,254,981 | 2,273,435 | 2,352,727 | 2,452,870 |
FY2016 Spending Category Chart
