Quick Links
- Statewide Summary
- Judiciary
- Independents
- Administration and Finance
- Administration & Finance
- Dev. Disabilities Council
- Capital Asset Management
- Bureau of the State House
- Office on Disability
- Teachers' Retirement Board
- Group Insurance
- Public Employee Retirement
- Administrative Law Appeals
- George Fingold Library
- Dept. of Revenue
- Appellate Tax Board
- Health Policy Commission
- Human Resources Division
- Civil Service Commission
- Operational Services Division
- Information Technology
- Energy & Environmental Affairs
- Health and Human Services
- Transportation
- Housing & Economic Development
- Labor & Workforce Development
- Education
- Public Safety
- Legislature
- All Account Listing
- Veto Listing
- Local Aid - Section 3
- Outside Sections
- Downloads
- Navigation Guide
- Budget Glossary
- Helpful Links
| SPENDING CATEGORY |
FY2012 Expended |
FY2013 Expended |
FY2014 Expended |
FY2015 Projected |
FY2016 GAA |
|---|---|---|---|---|---|
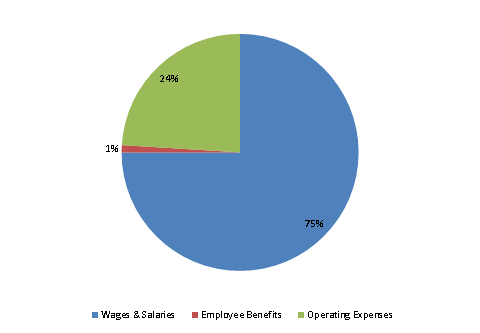
| Wages & Salaries | 4,169 | 4,236 | 4,812 | 6,239 | 10,388 |
| Employee Benefits | 89 | 66 | 78 | 132 | 137 |
| Operating Expenses | 1,218 | 1,212 | 1,981 | 3,694 | 3,328 |
| Debt Service | 0 | 0 | 0 | 0 | 0 |
| TOTAL | 5,475 | 5,514 | 6,871 | 10,065 | 13,853 |
FY2016 Spending Category Chart
