Quick Links
- Statewide Summary
- All Account Listing
- Veto Listing
- Local Aid - Section 3
- Outside Sections
- Downloads
- Navigation Guide
- Budget Glossary
- Helpful Links
| SPENDING CATEGORY |
FY2012 Expended |
FY2013 Expended |
FY2014 Expended |
FY2015 Projected |
FY2016 GAA |
|---|---|---|---|---|---|
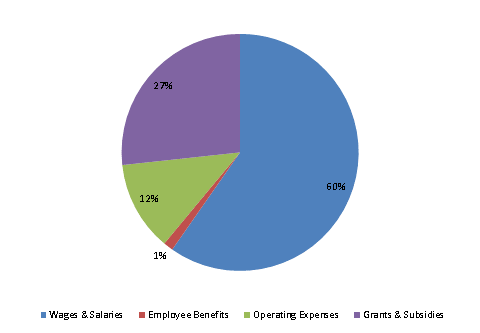
| Wages & Salaries | 17,329 | 17,483 | 18,424 | 19,653 | 19,976 |
| Employee Benefits | 523 | 394 | 379 | 476 | 447 |
| Operating Expenses | 3,655 | 4,147 | 4,271 | 7,853 | 4,100 |
| Grants & Subsidies | 1,788 | 1,795 | 4,711 | 1,310 | 8,934 |
| TOTAL | 23,295 | 23,820 | 27,786 | 29,291 | 33,457 |
FY2016 Spending Category Chart
