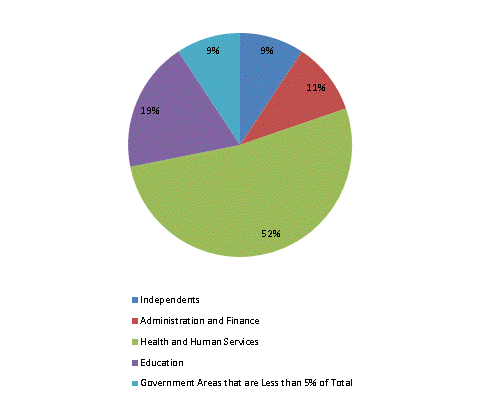
| GOVERNMENT AREA | FY2014 Conference |
FY2014 Vetoes * |
FY2014 Overrides |
FY2014 GAA |
|---|---|---|---|---|
| Judiciary | 787,422 | -30 | 30 | 787,422 |
| Independents | 3,164,883 | -2,150 | 2,150 | 3,164,883 |
| Administration and Finance | 3,565,099 | -181,070 | 181,070 | 3,565,099 |
| Energy & Environmental Affairs | 219,118 | -610 | 610 | 219,118 |
| Health and Human Services | 17,682,039 | -3,690 | 3,690 | 17,682,039 |
| Transportation | 590,258 | -240,000 | 240,000 | 590,258 |
| Housing & Economic Development | 474,857 | -1,455 | 1,455 | 474,857 |
| Labor & Workforce Development | 42,390 | 0 | 0 | 42,390 |
| Education | 6,475,261 | -2,021 | 2,021 | 6,475,261 |
| Public Safety | 996,345 | -4,380 | 4,380 | 996,345 |
| Legislature | 65,374 | 0 | 0 | 65,374 |
| TOTAL | 34,063,045 | -435,406 | 435,406 | 34,063,045 |
FY2014 General Appropriations Act
