Quick Links
- Statewide Summary
- Judiciary
- Independents
- Administration and Finance
- Administration & Finance
- Dev. Disabilities Council
- Capital Asset Management
- Bureau of State Office Buildings
- Office on Disability
- Teachers' Retirement Board
- Group Insurance
- Public Employee Retirement
- Administrative Law Appeals
- George Fingold Library
- Dept. of Revenue
- Appellate Tax Board
- Human Resources Division
- Civil Service Commission
- Operational Services Division
- Information Technology
- The Health Care Security Trust
- Energy & Environmental Affairs
- Health and Human Services
- Transportation
- Housing & Economic Development
- Labor & Workforce Development
- Education
- Public Safety
- Legislature
- All Account Listing
- Veto Listing
- Local Aid - Section 3
- Outside Sections
- Downloads
- Navigation Guide
- Budget Glossary
- Helpful Links
| SPENDING CATEGORY |
FY2009 Expended |
FY2010 Expended |
FY2011 Expended |
FY2012 Projected |
FY2013 GAA |
|---|---|---|---|---|---|
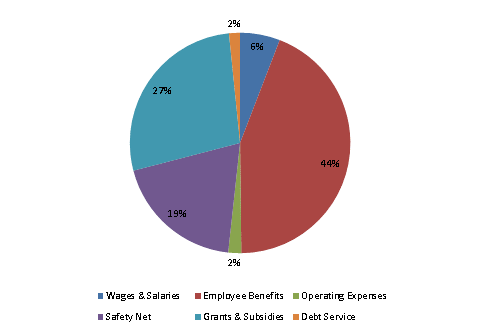
| Wages & Salaries | 178,264 | 169,184 | 220,185 | 209,396 | 232,688 |
| Employee Benefits | 1,000,340 | 1,087,789 | 1,315,178 | 1,651,047 | 1,747,149 |
| Operating Expenses | 437,464 | 523,407 | 868,332 | 74,410 | 76,033 |
| Safety Net | 61,928 | 13,099 | 210,940 | 650,440 | 763,447 |
| Grants & Subsidies | 82,644 | 1,228,556 | 1,090,974 | 1,095,837 | 1,090,541 |
| Debt Service | 65,108 | 67,353 | 66,448 | 70,077 | 64,020 |
| TOTAL | 1,825,748 | 3,089,389 | 3,772,057 | 3,751,207 | 3,973,878 |
FY2013 Spending Category Chart
