|
FY2012 House 1 |
FY2012 House Final |
FY2012 Senate Final |
FY2012 GAA |
|
|---|---|---|---|---|
| Budget Tracking | 7,578,756 | 7,733,424 | 7,733,424 | 7,733,424 |
|
FY2009 GAA |
FY2010 GAA |
FY2011 GAA |
FY2011 Projected |
FY2012 GAA |
|
|---|---|---|---|---|---|
| Historical Budget Levels | 6,980,895 | 6,333,424 | 5,833,424 | 7,733,424 | 7,733,424 |
* GAA is General Appropriation Act.
| SPENDING CATEGORY |
FY2008 Expended |
FY2009 Expended |
FY2010 Expended |
FY2011 Projected |
FY2012 GAA |
|---|---|---|---|---|---|
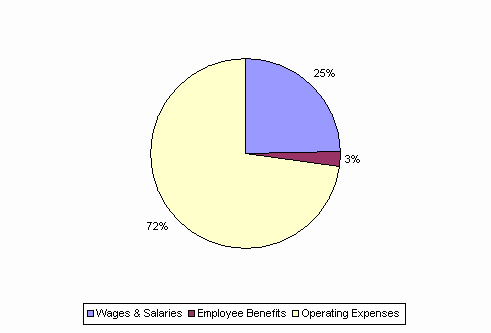
| Wages & Salaries | 2,285 | 2,350 | 2,374 | 2,026 | 1,909 |
| Employee Benefits | 212 | 229 | 26 | 197 | 201 |
| Operating Expenses | 3,341 | 4,188 | 5,369 | 5,510 | 5,623 |
| TOTAL | 5,838 | 6,766 | 7,769 | 7,733 | 7,733 |
FY2012 Spending Category Chart
