|
FY2012 House 1 |
FY2012 House Final |
FY2012 Senate Final |
FY2012 GAA |
|
|---|---|---|---|---|
| Budget Tracking | 17,003,251 | 17,350,256 | 17,350,256 | 17,350,256 |
|
FY2009 GAA |
FY2010 GAA |
FY2011 GAA |
FY2011 Projected |
FY2012 GAA |
|
|---|---|---|---|---|---|
| Historical Budget Levels | 18,964,007 | 17,067,606 | 16,234,707 | 17,350,256 | 17,350,256 |
* GAA is General Appropriation Act.
| SPENDING CATEGORY |
FY2008 Expended |
FY2009 Expended |
FY2010 Expended |
FY2011 Projected |
FY2012 GAA |
|---|---|---|---|---|---|
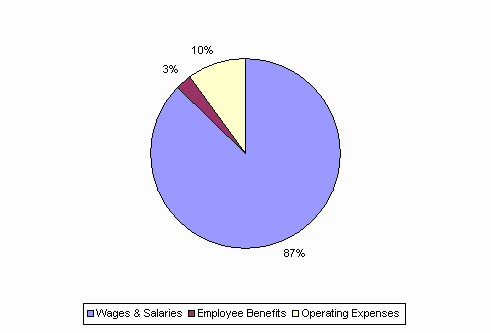
| Wages & Salaries | 16,428 | 16,789 | 16,582 | 15,190 | 15,146 |
| Employee Benefits | 637 | 502 | 318 | 454 | 463 |
| Operating Expenses | 896 | 653 | 450 | 1,706 | 1,741 |
| TOTAL | 17,961 | 17,944 | 17,350 | 17,350 | 17,350 |
FY2012 Spending Category Chart
