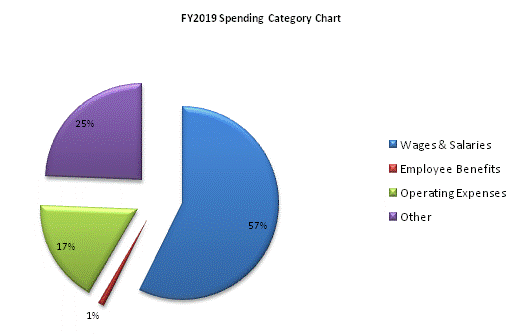
| SPENDING CATEGORY |
FY2015 Expended |
FY2016 Expended |
FY2017 Expended |
FY2018 Projected Spending |
FY2019 House 2 |
|---|---|---|---|---|---|
| Wages & Salaries | 6,127 | 5,940 | 6,562 | 6,718 | 6,800 |
| Employee Benefits | 124 | 122 | 132 | 125 | 124 |
| Operating Expenses | 2,284 | 1,630 | 1,893 | 2,038 | 2,046 |
| Other | 0 | 2,552 | 2,603 | 2,727 | 2,892 |
| TOTAL | 8,535 | 10,244 | 11,190 | 11,608 | 11,862 |
