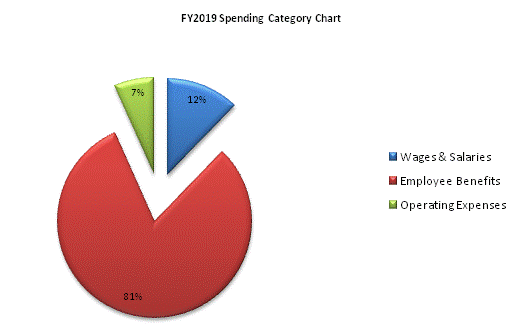
| SPENDING CATEGORY |
FY2015 Expended |
FY2016 Expended |
FY2017 Expended |
FY2018 Projected Spending |
FY2019 House 2 |
|---|---|---|---|---|---|
| Wages & Salaries | 4,581 | 4,387 | 3,564 | 3,282 | 4,658 |
| Employee Benefits | 31,312 | 30,239 | 32,421 | 30,969 | 30,980 |
| Operating Expenses | 942 | 634 | 1,281 | 1,667 | 2,538 |
| Other | 0 | 0 | 0 | 3 | 0 |
| TOTAL | 36,836 | 35,261 | 37,266 | 35,921 | 38,176 |
