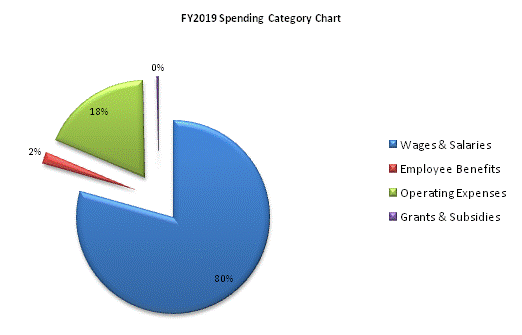
| SPENDING CATEGORY |
FY2015 Expended |
FY2016 Expended |
FY2017 Expended |
FY2018 Projected Spending |
FY2019 House 2 |
|---|---|---|---|---|---|
| Wages & Salaries | 46,351 | 39,541 | 40,136 | 40,810 | 42,023 |
| Employee Benefits | 987 | 844 | 770 | 1,024 | 1,037 |
| Operating Expenses | 9,154 | 8,527 | 8,762 | 9,562 | 9,708 |
| Grants & Subsidies | 800 | 649 | 0 | 179 | 179 |
| Other | 0 | 0 | 0 | 274 | 0 |
| TOTAL | 57,292 | 49,561 | 49,667 | 51,849 | 52,947 |
