| SPENDING CATEGORY |
FY2015 Expended |
FY2016 Expended |
FY2017 Expended |
FY2018 Projected Spending |
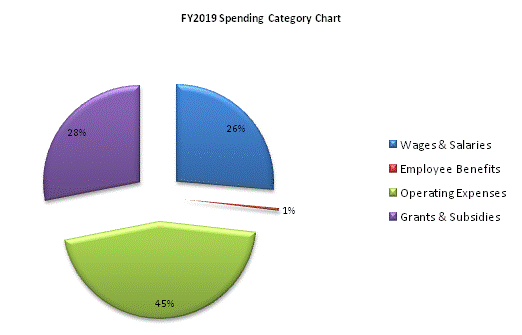
FY2019 House 2 |
|---|---|---|---|---|---|
| Wages & Salaries | 8,575 | 7,992 | 7,924 | 7,863 | 7,981 |
| Employee Benefits | 152 | 141 | 148 | 124 | 125 |
| Operating Expenses | 11,991 | 13,051 | 12,874 | 13,218 | 13,671 |
| Grants & Subsidies | 3,174 | 1,112 | 2,101 | 0 | 8,500 |
| Other | 0 | 0 | 0 | 250 | 0 |
| TOTAL | 23,893 | 22,296 | 23,048 | 21,455 | 30,277 |
