| SPENDING CATEGORY |
FY2015 Expended |
FY2016 Expended |
FY2017 Expended |
FY2018 Projected Spending |
FY2019 House 2 |
|---|---|---|---|---|---|
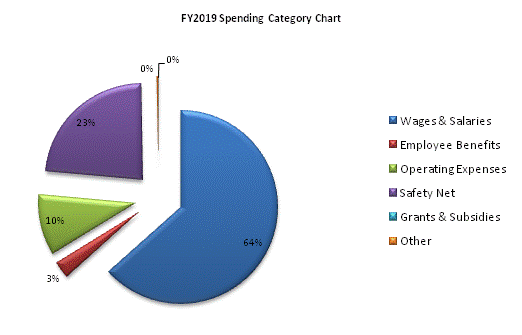
| Wages & Salaries | 403,443 | 401,656 | 410,042 | 416,720 | 427,273 |
| Employee Benefits | 17,659 | 18,251 | 18,715 | 19,030 | 19,326 |
| Operating Expenses | 61,321 | 59,895 | 56,196 | 67,329 | 68,631 |
| Safety Net | 103,428 | 102,699 | 123,537 | 145,771 | 156,999 |
| Grants & Subsidies | 0 | 2,668 | 2,200 | 2,290 | 90 |
| Other | 731 | 1,725 | 1,725 | 1,985 | 1,725 |
| TOTAL | 586,584 | 586,895 | 612,415 | 653,124 | 674,045 |
