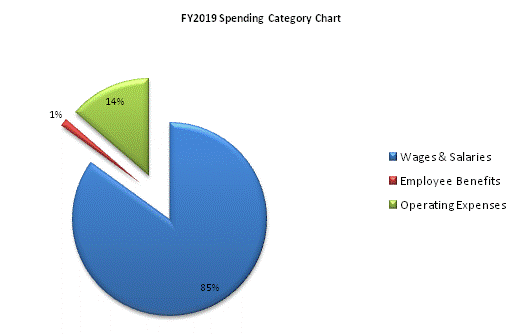
| SPENDING CATEGORY |
FY2015 Expended |
FY2016 Expended |
FY2017 Expended |
FY2018 Projected Spending |
FY2019 House 2 |
|---|---|---|---|---|---|
| Wages & Salaries | 8,539 | 9,004 | 9,787 | 10,300 | 15,197 |
| Employee Benefits | 205 | 184 | 225 | 235 | 235 |
| Operating Expenses | 2,129 | 2,178 | 1,984 | 2,207 | 2,442 |
| TOTAL | 10,874 | 11,367 | 11,996 | 12,742 | 17,874 |