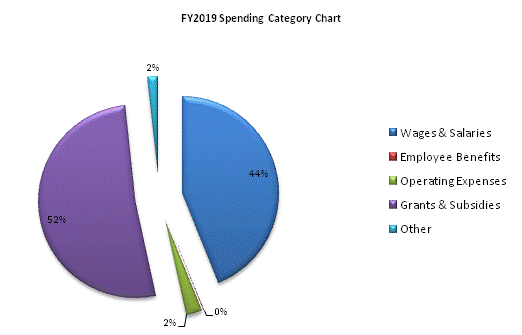
| SPENDING CATEGORY |
FY2015 Expended |
FY2016 Expended |
FY2017 Expended |
FY2018 Projected Spending |
FY2019 House 2 |
|---|---|---|---|---|---|
| Wages & Salaries | 31,273 | 26,344 | 33,594 | 88,195 | 131,257 |
| Employee Benefits | 525 | 29,589 | 706 | 370 | 331 |
| Operating Expenses | 10,811 | 11,234 | 10,098 | 27,183 | 7,767 |
| Safety Net | 251 | 57 | 41 | 317 | 0 |
| Grants & Subsidies | 139,951 | 142,700 | 142,376 | 157,896 | 154,653 |
| Other | 49 | 34 | 22 | 2,460 | 5,027 |
| TOTAL | 182,860 | 209,958 | 186,836 | 276,420 | 299,036 |
