| SPENDING CATEGORY |
FY2015 Expended |
FY2016 Expended |
FY2017 Expended |
FY2018 Projected Spending |
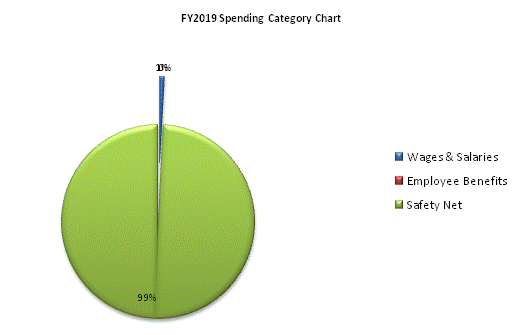
FY2019 House 2 |
|---|---|---|---|---|---|
| Wages & Salaries | 238 | 165 | 186 | 237 | 243 |
| Employee Benefits | 6 | 5 | 4 | 5 | 5 |
| Operating Expenses | 112 | 0 | 0 | 0 | 0 |
| Safety Net | 22,406 | 23,063 | 28,128 | 28,678 | 31,364 |
| TOTAL | 22,762 | 23,232 | 28,318 | 28,920 | 31,612 |
