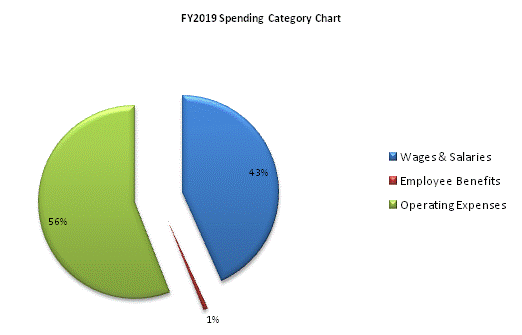
| SPENDING CATEGORY |
FY2015 Expended |
FY2016 Expended |
FY2017 Expended |
FY2018 Projected Spending |
FY2019 House 2 |
|---|---|---|---|---|---|
| Wages & Salaries | 7,069 | 6,938 | 7,022 | 6,613 | 6,613 |
| Employee Benefits | 120 | 124 | 145 | 99 | 110 |
| Operating Expenses | 14,135 | 14,244 | 13,017 | 9,804 | 8,528 |
| Other | 0 | 0 | 0 | 0 | 0 |
| TOTAL | 21,324 | 21,307 | 20,184 | 16,516 | 15,251 |
