| SPENDING CATEGORY |
FY2015 Expended |
FY2016 Expended |
FY2017 Expended |
FY2018 Projected Spending |
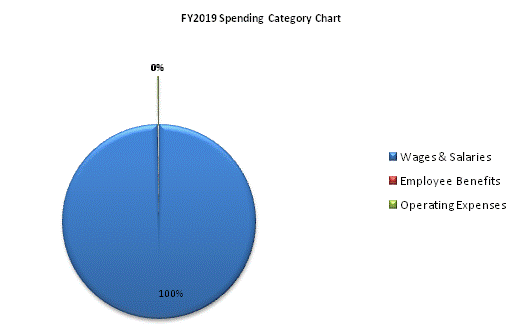
FY2019 House 2 |
|---|---|---|---|---|---|
| Wages & Salaries | 24,974 | 25,855 | 26,387 | 27,036 | 27,036 |
| Employee Benefits | 397 | 427 | 438 | 5 | 5 |
| Operating Expenses | 0 | 0 | 49 | 53 | 53 |
| TOTAL | 25,372 | 26,281 | 26,875 | 27,094 | 27,094 |
