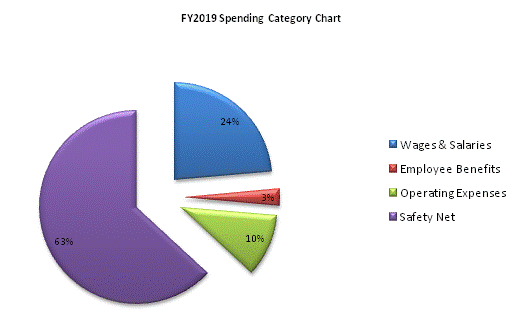
| SPENDING CATEGORY |
FY2015 Expended |
FY2016 Expended |
FY2017 Expended |
FY2018 Projected Spending |
FY2019 House 2 |
|---|---|---|---|---|---|
| Wages & Salaries | 24,266 | 24,199 | 25,896 | 26,381 | 27,198 |
| Employee Benefits | 1,702 | 2,866 | 2,534 | 3,087 | 3,123 |
| Operating Expenses | 11,145 | 10,954 | 10,305 | 12,000 | 12,193 |
| Safety Net | 75,025 | 74,601 | 74,038 | 74,781 | 72,669 |
| Other | 0 | 0 | 0 | 8 | 0 |
| TOTAL | 112,138 | 112,619 | 112,773 | 116,257 | 115,182 |