| SPENDING CATEGORY |
FY2015 Expended |
FY2016 Expended |
FY2017 Expended |
FY2018 Projected Spending |
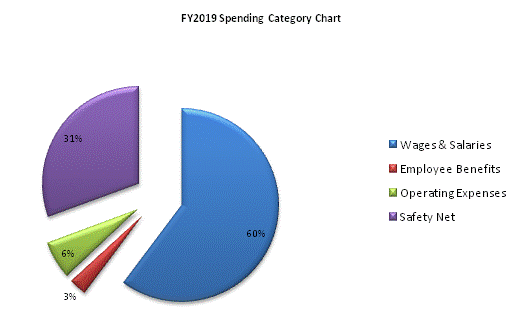
FY2019 House 2 |
|---|---|---|---|---|---|
| Wages & Salaries | 2,460 | 2,266 | 2,413 | 2,531 | 2,542 |
| Employee Benefits | 111 | 125 | 119 | 125 | 125 |
| Operating Expenses | 246 | 241 | 233 | 266 | 266 |
| Safety Net | 1,200 | 1,227 | 1,276 | 1,272 | 1,289 |
| TOTAL | 4,017 | 3,859 | 4,041 | 4,193 | 4,222 |
