| SPENDING CATEGORY |
FY2015 Expended |
FY2016 Expended |
FY2017 Expended |
FY2018 Projected Spending |
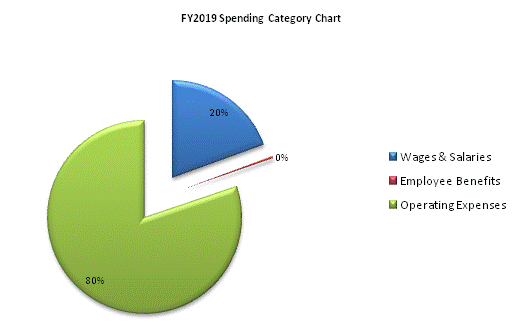
FY2019 House 2 |
|---|---|---|---|---|---|
| Wages & Salaries | 9,607 | 8,528 | 6,691 | 6,315 | 6,230 |
| Employee Benefits | 200 | 176 | 148 | 113 | 113 |
| Operating Expenses | 13,296 | 10,109 | 12,852 | 25,679 | 25,679 |
| TOTAL | 23,102 | 18,813 | 19,691 | 32,107 | 32,022 |
