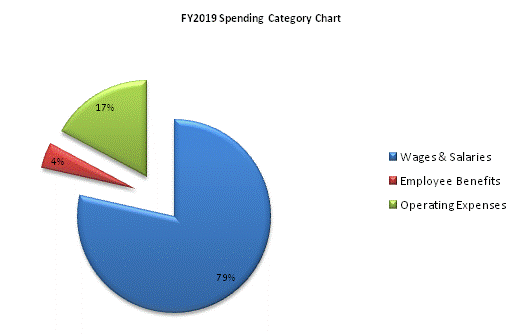
| SPENDING CATEGORY |
FY2015 Expended |
FY2016 Expended |
FY2017 Expended |
FY2018 Projected Spending |
FY2019 House 2 |
|---|---|---|---|---|---|
| Wages & Salaries | 30,957 | 29,637 | 28,246 | 28,105 | 29,814 |
| Employee Benefits | 1,771 | 1,612 | 1,688 | 1,645 | 1,640 |
| Operating Expenses | 7,523 | 7,085 | 5,915 | 5,926 | 6,516 |
| Grants & Subsidies | 114 | 324 | 0 | 0 | 0 |
| Other | 0 | 0 | 0 | 1,783 | 0 |
| TOTAL | 40,365 | 38,658 | 35,849 | 37,458 | 37,970 |
