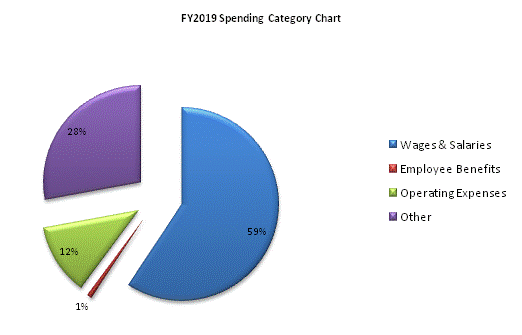
| SPENDING CATEGORY |
FY2015 Expended |
FY2016 Expended |
FY2017 Expended |
FY2018 Projected Spending |
FY2019 House 2 |
|---|---|---|---|---|---|
| Wages & Salaries | 23,954 | 25,806 | 26,335 | 31,129 | 21,239 |
| Employee Benefits | 403 | 454 | 457 | 450 | 309 |
| Operating Expenses | 49,360 | 61,626 | 78,242 | 69,574 | 4,289 |
| Other | 0 | 0 | 0 | 33,364 | 10,000 |
| TOTAL | 73,718 | 87,886 | 105,034 | 134,518 | 35,837 |
