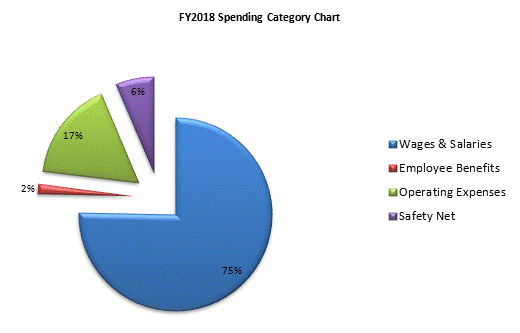
| SPENDING CATEGORY |
FY2014
Expended |
FY2015
Expended |
FY2016
Expended |
FY2017
Projected Spending |
FY2018
House 1 |
|---|---|---|---|---|---|
| Wages & Salaries | 30,907 | 31,669 | 32,823 | 35,537 | 36,580 |
| Employee Benefits | 592 | 657 | 730 | 773 | 773 |
| Operating Expenses | 7,240 | 6,980 | 7,375 | 7,729 | 8,128 |
| Safety Net | 2,881 | 2,899 | 2,998 | 2,990 | 3,090 |
| TOTAL | 41,620 | 42,205 | 43,925 | 47,028 | 48,570 |
