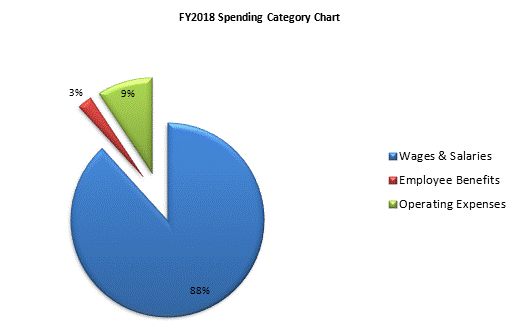
| SPENDING CATEGORY |
FY2014
Expended |
FY2015
Expended |
FY2016
Expended |
FY2017
Projected Spending |
FY2018
House 1 |
|---|---|---|---|---|---|
| Wages & Salaries | 2,794 | 3,234 | 3,326 | 3,667 | 3,754 |
| Employee Benefits | 56 | 75 | 90 | 103 | 106 |
| Operating Expenses | 786 | 490 | 693 | 393 | 393 |
| TOTAL | 3,637 | 3,799 | 4,108 | 4,164 | 4,253 |