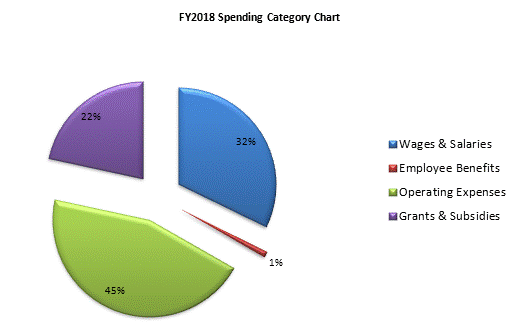
| SPENDING CATEGORY |
FY2014
Expended |
FY2015
Expended |
FY2016
Expended |
FY2017
Projected Spending |
FY2018
House 1 |
|---|---|---|---|---|---|
| Wages & Salaries | 8,631 | 9,160 | 9,267 | 9,994 | 9,491 |
| Employee Benefits | 207 | 248 | 216 | 318 | 291 |
| Operating Expenses | 15,848 | 14,340 | 14,457 | 13,305 | 13,282 |
| Grants & Subsidies | 7,103 | 8,287 | 9,302 | 6,799 | 6,368 |
| TOTAL | 31,789 | 32,034 | 33,243 | 30,415 | 29,431 |
