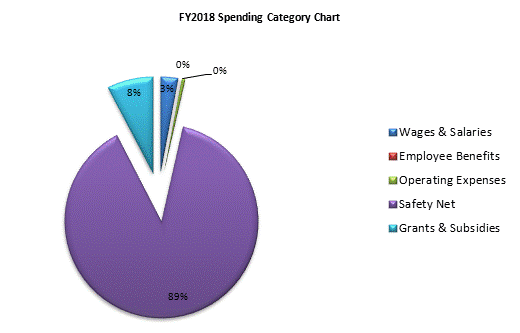
| SPENDING CATEGORY |
FY2014
Expended |
FY2015
Expended |
FY2016
Expended |
FY2017
Projected Spending |
FY2018
House 1 |
|---|---|---|---|---|---|
| Wages & Salaries | 13,609 | 14,856 | 13,524 | 14,776 | 16,331 |
| Employee Benefits | 584 | 590 | 593 | 633 | 634 |
| Operating Expenses | 2,823 | 2,576 | 6,632 | 3,299 | 3,291 |
| Safety Net | 449,556 | 477,410 | 484,328 | 487,653 | 504,651 |
| Grants & Subsidies | 42,851 | 42,191 | 46,190 | 44,699 | 43,124 |
| TOTAL | 509,422 | 537,624 | 551,267 | 551,061 | 568,030 |
