| SPENDING CATEGORY |
FY2014
Expended |
FY2015
Expended |
FY2016
Expended |
FY2017
Projected Spending |
FY2018
House 1 |
|---|---|---|---|---|---|
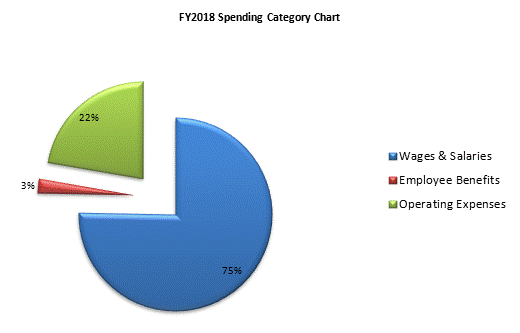
| Wages & Salaries | 8,672 | 9,385 | 10,030 | 10,997 | 11,440 |
| Employee Benefits | 357 | 314 | 315 | 357 | 363 |
| Operating Expenses | 3,045 | 3,006 | 2,916 | 3,320 | 3,389 |
| TOTAL | 12,073 | 12,705 | 13,260 | 14,675 | 15,193 |
