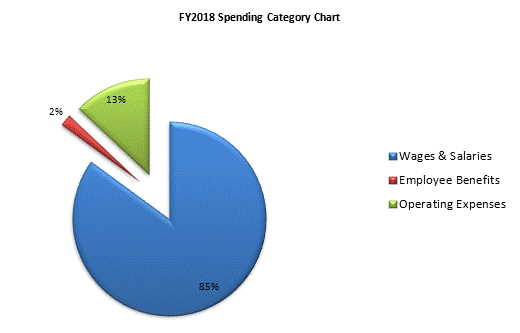
| SPENDING CATEGORY |
FY2014
Expended |
FY2015
Expended |
FY2016
Expended |
FY2017
Projected Spending |
FY2018
House 1 |
|---|---|---|---|---|---|
| Wages & Salaries | 2,038 | 2,217 | 2,454 | 2,604 | 2,663 |
| Employee Benefits | 39 | 56 | 56 | 60 | 63 |
| Operating Expenses | 335 | 451 | 433 | 379 | 406 |
| TOTAL | 2,412 | 2,724 | 2,943 | 3,043 | 3,131 |